Bulgarian vs Tsimshian In Labor Force | Age 16-19
COMPARE
Bulgarian
Tsimshian
In Labor Force | Age 16-19
In Labor Force | Age 16-19 Comparison
Bulgarians
Tsimshian
38.3%
IN LABOR FORCE | AGE 16-19
97.9/ 100
METRIC RATING
115th/ 347
METRIC RANK
37.4%
IN LABOR FORCE | AGE 16-19
84.7/ 100
METRIC RATING
150th/ 347
METRIC RANK
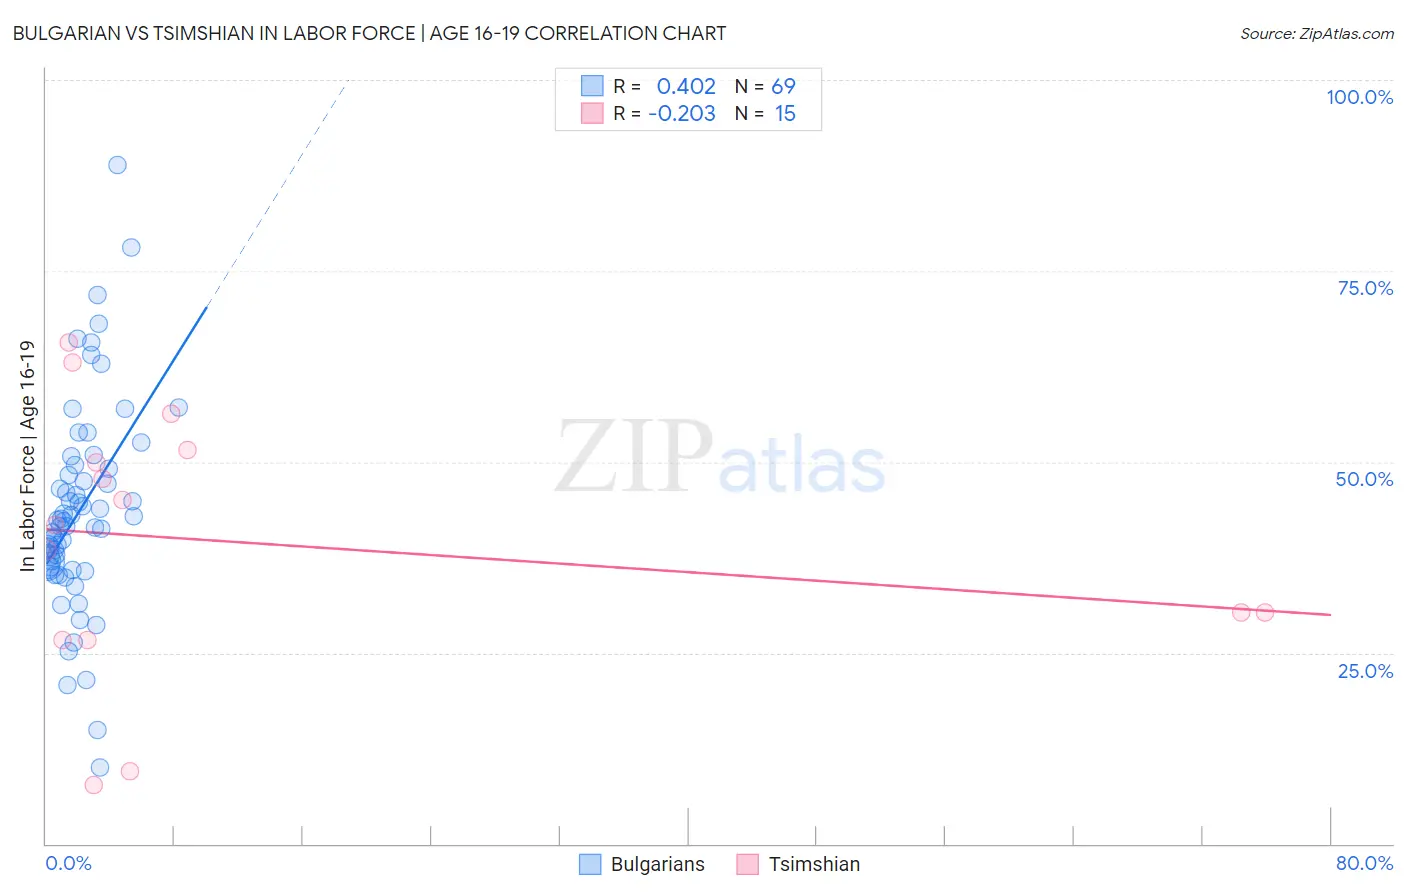
Bulgarian vs Tsimshian In Labor Force | Age 16-19 Correlation Chart
The statistical analysis conducted on geographies consisting of 205,432,687 people shows a moderate positive correlation between the proportion of Bulgarians and labor force participation rate among population between the ages 16 and 19 in the United States with a correlation coefficient (R) of 0.402 and weighted average of 38.3%. Similarly, the statistical analysis conducted on geographies consisting of 15,624,472 people shows a weak negative correlation between the proportion of Tsimshian and labor force participation rate among population between the ages 16 and 19 in the United States with a correlation coefficient (R) of -0.203 and weighted average of 37.4%, a difference of 2.6%.
In Labor Force | Age 16-19 Correlation Summary
| Measurement | Bulgarian | Tsimshian |
| Minimum | 10.0% | 7.7% |
| Maximum | 88.9% | 65.7% |
| Range | 78.9% | 58.0% |
| Mean | 43.6% | 39.4% |
| Median | 42.3% | 41.8% |
| Interquartile 25% (IQ1) | 36.2% | 26.6% |
| Interquartile 75% (IQ3) | 49.3% | 51.5% |
| Interquartile Range (IQR) | 13.1% | 24.9% |
| Standard Deviation (Sample) | 13.7% | 17.5% |
| Standard Deviation (Population) | 13.6% | 16.9% |
Similar Demographics by In Labor Force | Age 16-19
Demographics Similar to Bulgarians by In Labor Force | Age 16-19
In terms of in labor force | age 16-19, the demographic groups most similar to Bulgarians are Colville (38.3%, a difference of 0.010%), Chickasaw (38.3%, a difference of 0.060%), Immigrants from Nepal (38.3%, a difference of 0.070%), Assyrian/Chaldean/Syriac (38.3%, a difference of 0.080%), and Hawaiian (38.4%, a difference of 0.15%).
| Demographics | Rating | Rank | In Labor Force | Age 16-19 |
| Immigrants | Ethiopia | 98.7 /100 | #108 | Exceptional 38.6% |
| Lebanese | 98.7 /100 | #109 | Exceptional 38.6% |
| Maltese | 98.6 /100 | #110 | Exceptional 38.5% |
| Crow | 98.5 /100 | #111 | Exceptional 38.5% |
| Immigrants | Scotland | 98.5 /100 | #112 | Exceptional 38.5% |
| Sub-Saharan Africans | 98.3 /100 | #113 | Exceptional 38.4% |
| Hawaiians | 98.2 /100 | #114 | Exceptional 38.4% |
| Bulgarians | 97.9 /100 | #115 | Exceptional 38.3% |
| Colville | 97.9 /100 | #116 | Exceptional 38.3% |
| Chickasaw | 97.8 /100 | #117 | Exceptional 38.3% |
| Immigrants | Nepal | 97.8 /100 | #118 | Exceptional 38.3% |
| Assyrians/Chaldeans/Syriacs | 97.8 /100 | #119 | Exceptional 38.3% |
| Ukrainians | 97.6 /100 | #120 | Exceptional 38.3% |
| Ethiopians | 97.4 /100 | #121 | Exceptional 38.2% |
| Guamanians/Chamorros | 97.4 /100 | #122 | Exceptional 38.2% |
Demographics Similar to Tsimshian by In Labor Force | Age 16-19
In terms of in labor force | age 16-19, the demographic groups most similar to Tsimshian are Native Hawaiian (37.4%, a difference of 0.030%), Immigrants from Poland (37.3%, a difference of 0.030%), Immigrants from Sierra Leone (37.3%, a difference of 0.10%), Arapaho (37.3%, a difference of 0.25%), and Romanian (37.5%, a difference of 0.26%).
| Demographics | Rating | Rank | In Labor Force | Age 16-19 |
| Pakistanis | 89.5 /100 | #143 | Excellent 37.6% |
| Japanese | 89.3 /100 | #144 | Excellent 37.5% |
| Paiute | 89.3 /100 | #145 | Excellent 37.5% |
| Immigrants | Western Europe | 88.9 /100 | #146 | Excellent 37.5% |
| Brazilians | 88.7 /100 | #147 | Excellent 37.5% |
| Romanians | 87.3 /100 | #148 | Excellent 37.5% |
| Native Hawaiians | 85.0 /100 | #149 | Excellent 37.4% |
| Tsimshian | 84.7 /100 | #150 | Excellent 37.4% |
| Immigrants | Poland | 84.4 /100 | #151 | Excellent 37.3% |
| Immigrants | Sierra Leone | 83.6 /100 | #152 | Excellent 37.3% |
| Arapaho | 81.8 /100 | #153 | Excellent 37.3% |
| Immigrants | Bulgaria | 81.6 /100 | #154 | Excellent 37.3% |
| Immigrants | Lithuania | 80.7 /100 | #155 | Excellent 37.2% |
| Kiowa | 80.4 /100 | #156 | Excellent 37.2% |
| Immigrants | Brazil | 76.5 /100 | #157 | Good 37.1% |