South American vs Immigrants from Ghana In Labor Force | Age 16-19
COMPARE
South American
Immigrants from Ghana
In Labor Force | Age 16-19
In Labor Force | Age 16-19 Comparison
South Americans
Immigrants from Ghana
33.6%
IN LABOR FORCE | AGE 16-19
0.2/ 100
METRIC RATING
286th/ 347
METRIC RANK
35.4%
IN LABOR FORCE | AGE 16-19
7.3/ 100
METRIC RATING
222nd/ 347
METRIC RANK
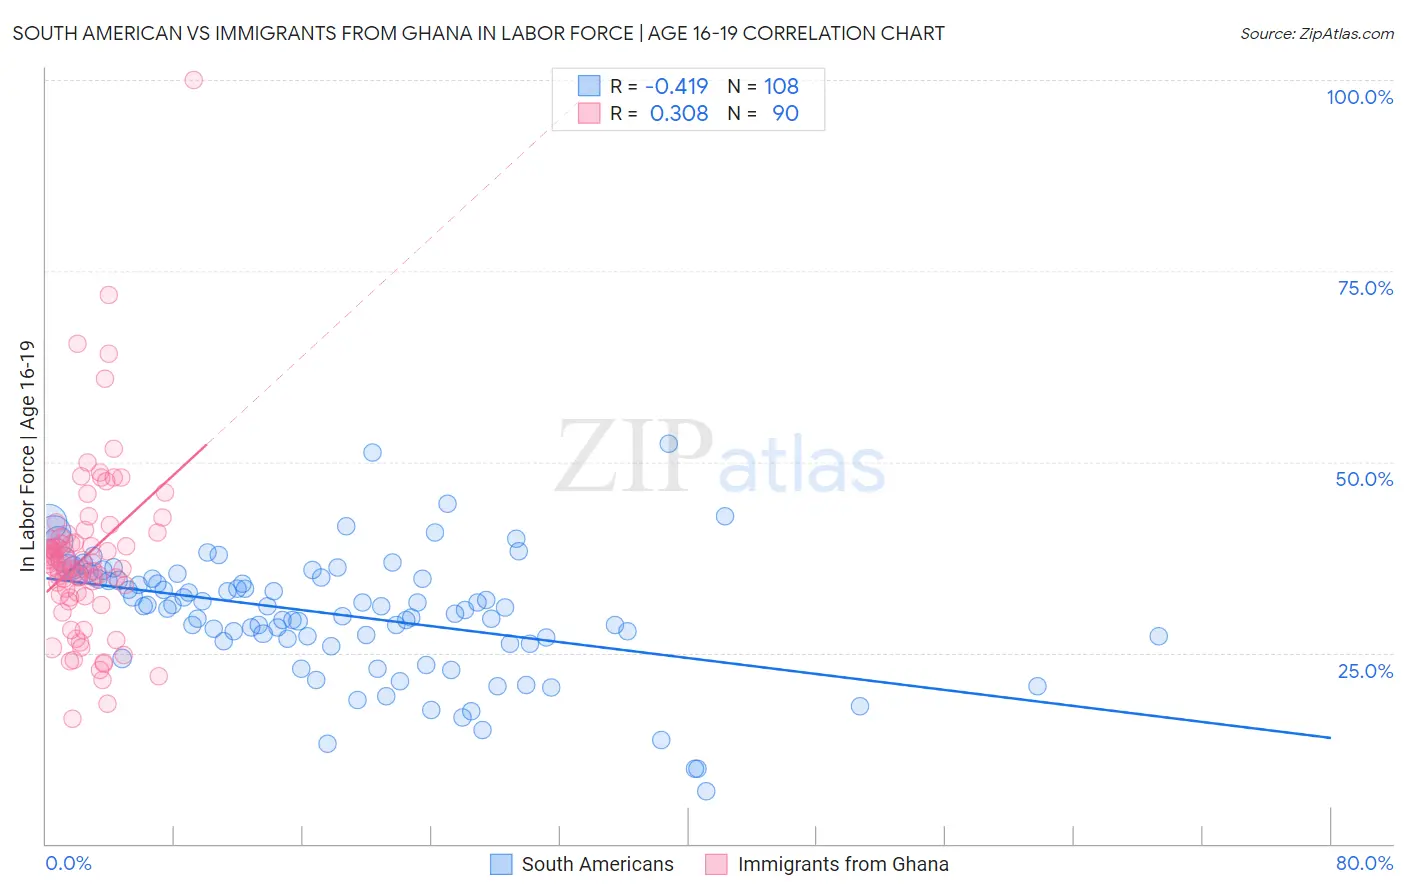
South American vs Immigrants from Ghana In Labor Force | Age 16-19 Correlation Chart
The statistical analysis conducted on geographies consisting of 492,865,168 people shows a moderate negative correlation between the proportion of South Americans and labor force participation rate among population between the ages 16 and 19 in the United States with a correlation coefficient (R) of -0.419 and weighted average of 33.6%. Similarly, the statistical analysis conducted on geographies consisting of 199,826,706 people shows a mild positive correlation between the proportion of Immigrants from Ghana and labor force participation rate among population between the ages 16 and 19 in the United States with a correlation coefficient (R) of 0.308 and weighted average of 35.4%, a difference of 5.4%.
In Labor Force | Age 16-19 Correlation Summary
| Measurement | South American | Immigrants from Ghana |
| Minimum | 6.8% | 16.3% |
| Maximum | 52.4% | 100.0% |
| Range | 45.6% | 83.7% |
| Mean | 30.0% | 37.7% |
| Median | 31.0% | 36.7% |
| Interquartile 25% (IQ1) | 26.6% | 32.5% |
| Interquartile 75% (IQ3) | 34.8% | 40.1% |
| Interquartile Range (IQR) | 8.2% | 7.5% |
| Standard Deviation (Sample) | 8.0% | 11.6% |
| Standard Deviation (Population) | 8.0% | 11.6% |
Similar Demographics by In Labor Force | Age 16-19
Demographics Similar to South Americans by In Labor Force | Age 16-19
In terms of in labor force | age 16-19, the demographic groups most similar to South Americans are U.S. Virgin Islander (33.6%, a difference of 0.080%), Nepalese (33.5%, a difference of 0.23%), Immigrants from Spain (33.7%, a difference of 0.27%), Immigrants from Indonesia (33.5%, a difference of 0.27%), and Immigrants from Singapore (33.5%, a difference of 0.27%).
| Demographics | Rating | Rank | In Labor Force | Age 16-19 |
| Paraguayans | 0.3 /100 | #279 | Tragic 33.8% |
| Taiwanese | 0.3 /100 | #280 | Tragic 33.8% |
| Cypriots | 0.3 /100 | #281 | Tragic 33.8% |
| Immigrants | Korea | 0.3 /100 | #282 | Tragic 33.8% |
| Immigrants | Venezuela | 0.2 /100 | #283 | Tragic 33.7% |
| Immigrants | Spain | 0.2 /100 | #284 | Tragic 33.7% |
| U.S. Virgin Islanders | 0.2 /100 | #285 | Tragic 33.6% |
| South Americans | 0.2 /100 | #286 | Tragic 33.6% |
| Nepalese | 0.1 /100 | #287 | Tragic 33.5% |
| Immigrants | Indonesia | 0.1 /100 | #288 | Tragic 33.5% |
| Immigrants | Singapore | 0.1 /100 | #289 | Tragic 33.5% |
| Immigrants | Colombia | 0.1 /100 | #290 | Tragic 33.5% |
| Immigrants | Belarus | 0.1 /100 | #291 | Tragic 33.4% |
| Haitians | 0.1 /100 | #292 | Tragic 33.4% |
| Immigrants | South America | 0.1 /100 | #293 | Tragic 33.3% |
Demographics Similar to Immigrants from Ghana by In Labor Force | Age 16-19
In terms of in labor force | age 16-19, the demographic groups most similar to Immigrants from Ghana are Turkish (35.4%, a difference of 0.010%), Ghanaian (35.3%, a difference of 0.15%), Honduran (35.3%, a difference of 0.16%), Immigrants from Bahamas (35.5%, a difference of 0.19%), and Guatemalan (35.5%, a difference of 0.24%).
| Demographics | Rating | Rank | In Labor Force | Age 16-19 |
| Immigrants | South Eastern Asia | 10.8 /100 | #215 | Poor 35.6% |
| Dutch West Indians | 10.7 /100 | #216 | Poor 35.6% |
| Immigrants | Costa Rica | 10.7 /100 | #217 | Poor 35.6% |
| Sri Lankans | 9.8 /100 | #218 | Tragic 35.5% |
| Guatemalans | 8.6 /100 | #219 | Tragic 35.5% |
| Immigrants | Bahamas | 8.3 /100 | #220 | Tragic 35.5% |
| Turks | 7.3 /100 | #221 | Tragic 35.4% |
| Immigrants | Ghana | 7.3 /100 | #222 | Tragic 35.4% |
| Ghanaians | 6.5 /100 | #223 | Tragic 35.3% |
| Hondurans | 6.5 /100 | #224 | Tragic 35.3% |
| Immigrants | Belgium | 6.1 /100 | #225 | Tragic 35.3% |
| Immigrants | Guatemala | 5.7 /100 | #226 | Tragic 35.3% |
| Mongolians | 5.7 /100 | #227 | Tragic 35.3% |
| Immigrants | Senegal | 5.5 /100 | #228 | Tragic 35.3% |
| Immigrants | Lebanon | 5.0 /100 | #229 | Tragic 35.2% |