Immigrants from Nigeria vs Immigrants from Ghana In Labor Force | Age 16-19

COMPARE

Immigrants from Nigeria
Race
Ancestry
AfghanAfricanAlaska NativeAlaskan AthabascanAlbanianAleutAlsatianAmericanApacheArabArapahoArgentineanArmenianAssyrian/Chaldean/SyriacAustralianAustrianBahamianBangladeshiBarbadianBasqueBelgianBelizeanBermudanBhutaneseBlackfeetBolivianBrazilianBritishBritish West IndianBulgarianBurmeseCajunCambodianCanadianCape VerdeanCarpatho RusynCelticCentral AmericanCentral American IndianCherokeeCheyenneChickasawChileanChineseChippewaChoctawColombianColvilleComancheCosta RicanCreeCreekCroatianCrowCubanCypriotCzechCzechoslovakianDanishDelawareDominicanDutchDutch West IndianEastern EuropeanEcuadorianEgyptianEnglishEstonianEthiopianEuropeanFijianFilipinoFinnishFrenchFrench American IndianFrench CanadianGermanGerman RussianGhanaianGreekGuamanian/ChamorroGuatemalanGuyaneseHaitianHmongHonduranHopiHoumaHungarianIcelanderIndian (Asian)IndonesianInupiatIranianIraqiIrishIroquoisIsraeliItalianJamaicanJapaneseJordanianKenyanKiowaKoreanLaotianLatvianLebaneseLiberianLithuanianLumbeeLuxembourgerMacedonianMalaysianMalteseMarshalleseMenomineeMexicanMexican American IndianMongolianMoroccanNative HawaiianNavajoNepaleseNew ZealanderNicaraguanNigerianNorthern EuropeanNorwegianOkinawanOsageOttawaPaiutePakistaniPalestinianPanamanianParaguayanPennsylvania GermanPeruvianPimaPolishPortuguesePotawatomiPuebloPuerto RicanPuget Sound SalishRomanianRussianSalvadoranSamoanScandinavianScotch-IrishScottishSeminoleSenegaleseSerbianShoshoneSierra LeoneanSiouxSlavicSlovakSloveneSomaliSouth AfricanSouth AmericanSouth American IndianSoviet UnionSpaniardSpanishSpanish AmericanSpanish American IndianSri LankanSubsaharan AfricanSudaneseSwedishSwissSyrianTaiwaneseThaiTlingit-HaidaTohono O'OdhamTonganTrinidadian and TobagonianTsimshianTurkishU.S. Virgin IslanderUgandanUkrainianUruguayanUteVenezuelanVietnameseWelshWest IndianYakamaYaquiYugoslavianYumanYup'ikZimbabwean
Immigration
NonimmigrantsImmigrantsAfghanistanAfricaAlbaniaArgentinaArmeniaAsiaAustraliaAustriaBahamasBangladeshBarbadosBelarusBelgiumBelizeBoliviaBosnia and HerzegovinaBrazilBulgariaBurma/MyanmarCabo VerdeCambodiaCameroonCanadaCaribbeanCentral AmericaChileChinaColombiaCongoCosta RicaCroatiaCubaCzechoslovakiaDenmarkDominicaDominican RepublicEastern AfricaEastern AsiaEastern EuropeEcuadorEgyptEl SalvadorEnglandEritreaEthiopiaEuropeFijiFranceGermanyGreeceGrenadaGuatemalaGuyanaHaitiHondurasHong KongHungaryIndiaIndonesiaIranIraqIrelandIsraelItalyJamaicaJapanJordanKazakhstanKenyaKoreaKuwaitLaosLatin AmericaLatviaLebanonLiberiaLithuaniaMalaysiaMexicoMicronesiaMiddle AfricaMoldovaMoroccoNepalNetherlandsNicaraguaNigeriaNorth AmericaNorth MacedoniaNorthern AfricaNorthern EuropeNorwayOceaniaPakistanPanamaPeruPhilippinesPolandPortugalRomaniaRussiaSaudi ArabiaScotlandSenegalSerbiaSierra LeoneSingaporeSomaliaSouth AfricaSouth AmericaSouth Central AsiaSouth Eastern AsiaSouthern EuropeSpainSri LankaSt. Vincent and the GrenadinesSudanSwedenSwitzerlandSyriaTaiwanThailandTrinidad and TobagoTurkeyUgandaUkraineUruguayUzbekistanVenezuelaVietnamWest IndiesWestern AfricaWestern AsiaWestern EuropeYemenZaireZimbabweAzores
Immigrants from Ghana
Race
Ancestry
AfghanAfricanAlaska NativeAlaskan AthabascanAlbanianAleutAlsatianAmericanApacheArabArapahoArgentineanArmenianAssyrian/Chaldean/SyriacAustralianAustrianBahamianBangladeshiBarbadianBasqueBelgianBelizeanBermudanBhutaneseBlackfeetBolivianBrazilianBritishBritish West IndianBulgarianBurmeseCajunCambodianCanadianCape VerdeanCarpatho RusynCelticCentral AmericanCentral American IndianCherokeeCheyenneChickasawChileanChineseChippewaChoctawColombianColvilleComancheCosta RicanCreeCreekCroatianCrowCubanCypriotCzechCzechoslovakianDanishDelawareDominicanDutchDutch West IndianEastern EuropeanEcuadorianEgyptianEnglishEstonianEthiopianEuropeanFijianFilipinoFinnishFrenchFrench American IndianFrench CanadianGermanGerman RussianGhanaianGreekGuamanian/ChamorroGuatemalanGuyaneseHaitianHmongHonduranHopiHoumaHungarianIcelanderIndian (Asian)IndonesianInupiatIranianIraqiIrishIroquoisIsraeliItalianJamaicanJapaneseJordanianKenyanKiowaKoreanLaotianLatvianLebaneseLiberianLithuanianLumbeeLuxembourgerMacedonianMalaysianMalteseMarshalleseMenomineeMexicanMexican American IndianMongolianMoroccanNative HawaiianNavajoNepaleseNew ZealanderNicaraguanNigerianNorthern EuropeanNorwegianOkinawanOsageOttawaPaiutePakistaniPalestinianPanamanianParaguayanPennsylvania GermanPeruvianPimaPolishPortuguesePotawatomiPuebloPuerto RicanPuget Sound SalishRomanianRussianSalvadoranSamoanScandinavianScotch-IrishScottishSeminoleSenegaleseSerbianShoshoneSierra LeoneanSiouxSlavicSlovakSloveneSomaliSouth AfricanSouth AmericanSouth American IndianSoviet UnionSpaniardSpanishSpanish AmericanSpanish American IndianSri LankanSubsaharan AfricanSudaneseSwedishSwissSyrianTaiwaneseThaiTlingit-HaidaTohono O'OdhamTonganTrinidadian and TobagonianTsimshianTurkishU.S. Virgin IslanderUgandanUkrainianUruguayanUteVenezuelanVietnameseWelshWest IndianYakamaYaquiYugoslavianYumanYup'ikZimbabwean
Immigration
NonimmigrantsImmigrantsAfghanistanAfricaAlbaniaArgentinaArmeniaAsiaAustraliaAustriaBahamasBangladeshBarbadosBelarusBelgiumBelizeBoliviaBosnia and HerzegovinaBrazilBulgariaBurma/MyanmarCabo VerdeCambodiaCameroonCanadaCaribbeanCentral AmericaChileChinaColombiaCongoCosta RicaCroatiaCubaCzechoslovakiaDenmarkDominicaDominican RepublicEastern AfricaEastern AsiaEastern EuropeEcuadorEgyptEl SalvadorEnglandEritreaEthiopiaEuropeFijiFranceGermanyGhanaGreeceGrenadaGuatemalaGuyanaHaitiHondurasHong KongHungaryIndiaIndonesiaIranIraqIrelandIsraelItalyJamaicaJapanJordanKazakhstanKenyaKoreaKuwaitLaosLatin AmericaLatviaLebanonLiberiaLithuaniaMalaysiaMexicoMicronesiaMiddle AfricaMoldovaMoroccoNepalNetherlandsNicaraguaNorth AmericaNorth MacedoniaNorthern AfricaNorthern EuropeNorwayOceaniaPakistanPanamaPeruPhilippinesPolandPortugalRomaniaRussiaSaudi ArabiaScotlandSenegalSerbiaSierra LeoneSingaporeSomaliaSouth AfricaSouth AmericaSouth Central AsiaSouth Eastern AsiaSouthern EuropeSpainSri LankaSt. Vincent and the GrenadinesSudanSwedenSwitzerlandSyriaTaiwanThailandTrinidad and TobagoTurkeyUgandaUkraineUruguayUzbekistanVenezuelaVietnamWest IndiesWestern AfricaWestern AsiaWestern EuropeYemenZaireZimbabweAzores
In Labor Force | Age 16-19
Income
Poverty
Unemployment
Labor Participation
Family Structure
Vehicle Availability
Education Level
Disability

In Labor Force | Age 16-19 Comparison

Immigrants from Nigeria

Immigrants from Ghana

Poor
Tragic
35.8%
IN LABOR FORCE | AGE 16-19
16.8/ 100
METRIC RATING
203rd/ 347
METRIC RANK
35.4%
IN LABOR FORCE | AGE 16-19
7.3/ 100
METRIC RATING
222nd/ 347
METRIC RANK

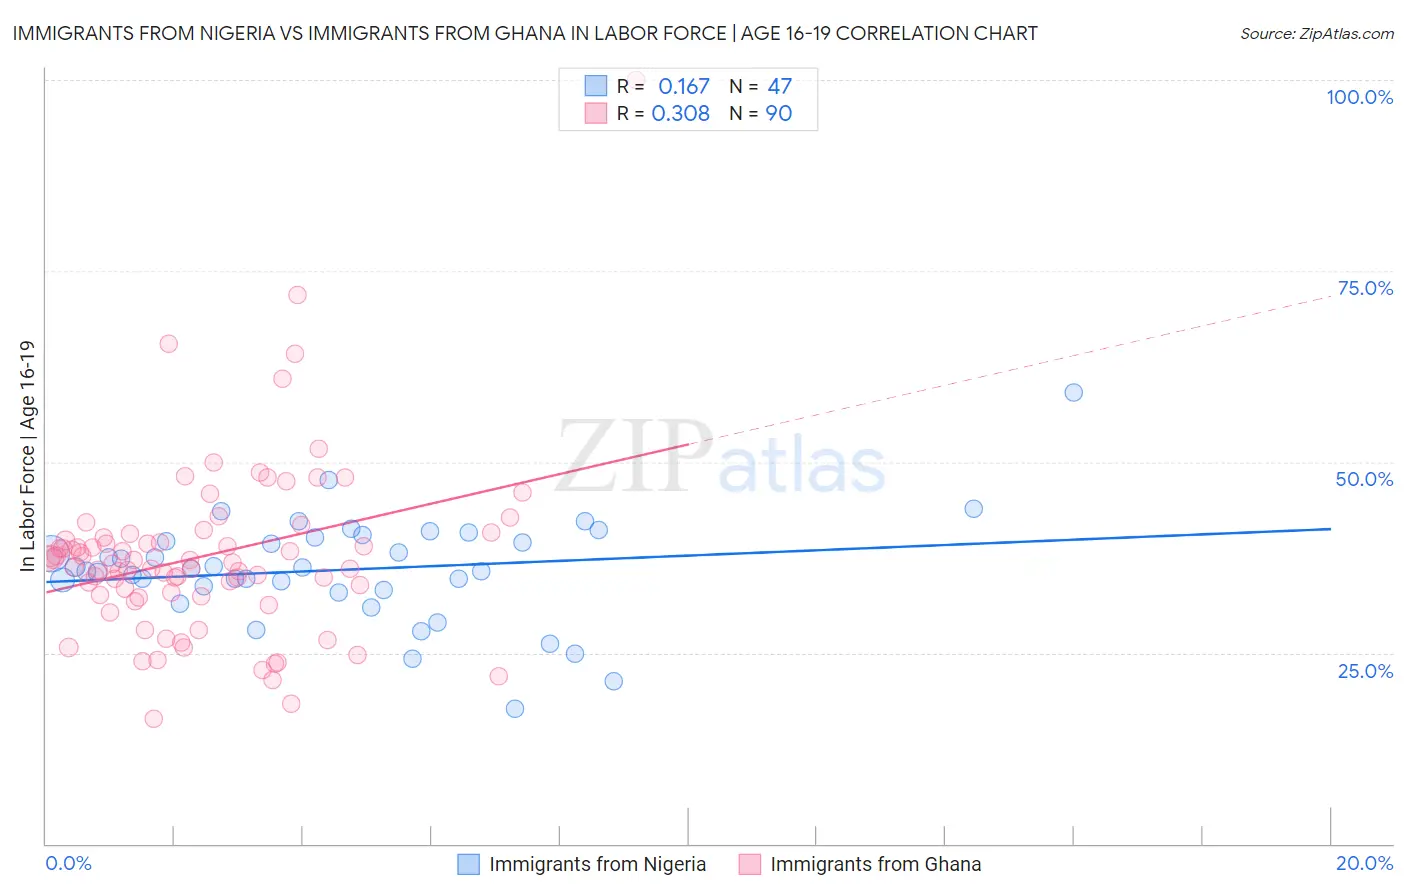
Immigrants from Nigeria vs Immigrants from Ghana In Labor Force | Age 16-19 Correlation Chart

The statistical analysis conducted on geographies consisting of 283,352,648 people shows a poor positive correlation between the proportion of Immigrants from Nigeria and labor force participation rate among population between the ages 16 and 19 in the United States with a correlation coefficient (R) of 0.167 and weighted average of 35.8%. Similarly, the statistical analysis conducted on geographies consisting of 199,826,706 people shows a mild positive correlation between the proportion of Immigrants from Ghana and labor force participation rate among population between the ages 16 and 19 in the United States with a correlation coefficient (R) of 0.308 and weighted average of 35.4%, a difference of 1.2%.
Immigrants from Nigeria vs Immigrants from Ghana In Labor Force | Age 16-19

In Labor Force | Age 16-19 Correlation Summary

MeasurementImmigrants from NigeriaImmigrants from Ghana
Minimum17.6%16.3%
Maximum59.1%100.0%
Range41.5%83.7%
Mean35.9%37.7%
Median35.9%36.7%
Interquartile 25% (IQ1)33.2%32.5%
Interquartile 75% (IQ3)40.2%40.1%
Interquartile Range (IQR)6.9%7.5%
Standard Deviation (Sample)7.0%11.6%
Standard Deviation (Population)6.9%11.6%

Demographics Similar to Immigrants from Nigeria and Immigrants from Ghana by In Labor Force | Age 16-19

In terms of in labor force | age 16-19, the demographic groups most similar to Immigrants from Nigeria are Senegalese (35.9%, a difference of 0.060%), Immigrants from Albania (35.8%, a difference of 0.17%), South American Indian (35.8%, a difference of 0.21%), Chilean (35.8%, a difference of 0.21%), and Immigrants from Eastern Europe (35.8%, a difference of 0.23%). Similarly, the demographic groups most similar to Immigrants from Ghana are Turkish (35.4%, a difference of 0.010%), Immigrants from Bahamas (35.5%, a difference of 0.19%), Guatemalan (35.5%, a difference of 0.24%), Sri Lankan (35.5%, a difference of 0.43%), and Dutch West Indian (35.6%, a difference of 0.55%).
DemographicsRating | RankIn Labor Force | Age 16-19
Senegalese
17.4
/100
|
#202
Poor
35.9%
Immigrants | Nigeria
16.8
/100
|
#203
Poor
35.8%
Immigrants | Albania
15.0
/100
|
#204
Poor
35.8%
South American Indians
14.6
/100
|
#205
Poor
35.8%
Chileans
14.6
/100
|
#206
Poor
35.8%
Immigrants | Eastern Europe
14.5
/100
|
#207
Poor
35.8%
Koreans
13.3
/100
|
#208
Poor
35.7%
Moroccans
12.7
/100
|
#209
Poor
35.7%
Immigrants | Switzerland
11.9
/100
|
#210
Poor
35.6%
Mexicans
11.9
/100
|
#211
Poor
35.6%
Houma
11.0
/100
|
#212
Poor
35.6%
Immigrants | Bolivia
11.0
/100
|
#213
Poor
35.6%
Apache
11.0
/100
|
#214
Poor
35.6%
Immigrants | South Eastern Asia
10.8
/100
|
#215
Poor
35.6%
Dutch West Indians
10.7
/100
|
#216
Poor
35.6%
Immigrants | Costa Rica
10.7
/100
|
#217
Poor
35.6%
Sri Lankans
9.8
/100
|
#218
Tragic
35.5%
Guatemalans
8.6
/100
|
#219
Tragic
35.5%
Immigrants | Bahamas
8.3
/100
|
#220
Tragic
35.5%
Turks
7.3
/100
|
#221
Tragic
35.4%
Immigrants | Ghana
7.3
/100
|
#222
Tragic
35.4%