Immigrants from Denmark vs Immigrants from Ghana In Labor Force | Age 16-19
COMPARE
Immigrants from Denmark
Immigrants from Ghana
In Labor Force | Age 16-19
In Labor Force | Age 16-19 Comparison
Immigrants from Denmark
Immigrants from Ghana
36.1%
IN LABOR FORCE | AGE 16-19
25.0/ 100
METRIC RATING
193rd/ 347
METRIC RANK
35.4%
IN LABOR FORCE | AGE 16-19
7.3/ 100
METRIC RATING
222nd/ 347
METRIC RANK
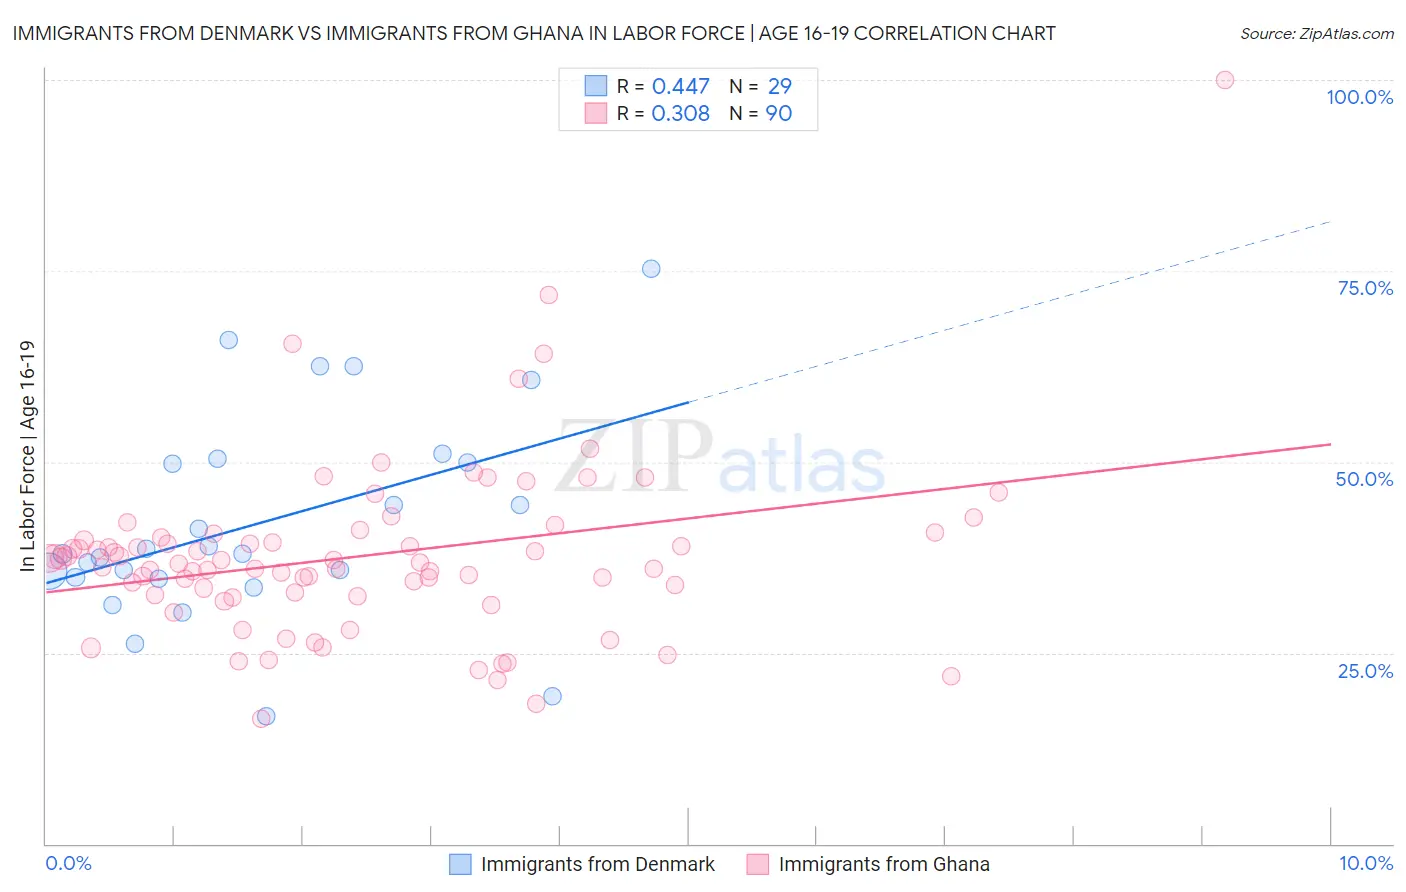
Immigrants from Denmark vs Immigrants from Ghana In Labor Force | Age 16-19 Correlation Chart
The statistical analysis conducted on geographies consisting of 136,287,705 people shows a moderate positive correlation between the proportion of Immigrants from Denmark and labor force participation rate among population between the ages 16 and 19 in the United States with a correlation coefficient (R) of 0.447 and weighted average of 36.1%. Similarly, the statistical analysis conducted on geographies consisting of 199,826,706 people shows a mild positive correlation between the proportion of Immigrants from Ghana and labor force participation rate among population between the ages 16 and 19 in the United States with a correlation coefficient (R) of 0.308 and weighted average of 35.4%, a difference of 1.9%.
In Labor Force | Age 16-19 Correlation Summary
| Measurement | Immigrants from Denmark | Immigrants from Ghana |
| Minimum | 16.7% | 16.3% |
| Maximum | 75.3% | 100.0% |
| Range | 58.6% | 83.7% |
| Mean | 42.1% | 37.7% |
| Median | 38.0% | 36.7% |
| Interquartile 25% (IQ1) | 34.8% | 32.5% |
| Interquartile 75% (IQ3) | 50.2% | 40.1% |
| Interquartile Range (IQR) | 15.4% | 7.5% |
| Standard Deviation (Sample) | 13.6% | 11.6% |
| Standard Deviation (Population) | 13.4% | 11.6% |
Similar Demographics by In Labor Force | Age 16-19
Demographics Similar to Immigrants from Denmark by In Labor Force | Age 16-19
In terms of in labor force | age 16-19, the demographic groups most similar to Immigrants from Denmark are Nigerian (36.1%, a difference of 0.030%), Afghan (36.1%, a difference of 0.040%), Bolivian (36.0%, a difference of 0.12%), Immigrants from Croatia (36.1%, a difference of 0.17%), and Panamanian (36.1%, a difference of 0.23%).
| Demographics | Rating | Rank | In Labor Force | Age 16-19 |
| Immigrants | Romania | 34.0 /100 | #186 | Fair 36.3% |
| Immigrants | Afghanistan | 34.0 /100 | #187 | Fair 36.3% |
| Immigrants | Europe | 31.8 /100 | #188 | Fair 36.2% |
| Immigrants | Hungary | 28.8 /100 | #189 | Fair 36.2% |
| Panamanians | 28.6 /100 | #190 | Fair 36.1% |
| Immigrants | Croatia | 27.5 /100 | #191 | Fair 36.1% |
| Afghans | 25.7 /100 | #192 | Fair 36.1% |
| Immigrants | Denmark | 25.0 /100 | #193 | Fair 36.1% |
| Nigerians | 24.6 /100 | #194 | Fair 36.1% |
| Bolivians | 23.3 /100 | #195 | Fair 36.0% |
| Mexican American Indians | 21.1 /100 | #196 | Fair 36.0% |
| Immigrants | Serbia | 21.0 /100 | #197 | Fair 36.0% |
| Immigrants | Northern Africa | 19.9 /100 | #198 | Poor 35.9% |
| Immigrants | Norway | 19.8 /100 | #199 | Poor 35.9% |
| Immigrants | Sweden | 18.8 /100 | #200 | Poor 35.9% |
Demographics Similar to Immigrants from Ghana by In Labor Force | Age 16-19
In terms of in labor force | age 16-19, the demographic groups most similar to Immigrants from Ghana are Turkish (35.4%, a difference of 0.010%), Ghanaian (35.3%, a difference of 0.15%), Honduran (35.3%, a difference of 0.16%), Immigrants from Bahamas (35.5%, a difference of 0.19%), and Guatemalan (35.5%, a difference of 0.24%).
| Demographics | Rating | Rank | In Labor Force | Age 16-19 |
| Immigrants | South Eastern Asia | 10.8 /100 | #215 | Poor 35.6% |
| Dutch West Indians | 10.7 /100 | #216 | Poor 35.6% |
| Immigrants | Costa Rica | 10.7 /100 | #217 | Poor 35.6% |
| Sri Lankans | 9.8 /100 | #218 | Tragic 35.5% |
| Guatemalans | 8.6 /100 | #219 | Tragic 35.5% |
| Immigrants | Bahamas | 8.3 /100 | #220 | Tragic 35.5% |
| Turks | 7.3 /100 | #221 | Tragic 35.4% |
| Immigrants | Ghana | 7.3 /100 | #222 | Tragic 35.4% |
| Ghanaians | 6.5 /100 | #223 | Tragic 35.3% |
| Hondurans | 6.5 /100 | #224 | Tragic 35.3% |
| Immigrants | Belgium | 6.1 /100 | #225 | Tragic 35.3% |
| Immigrants | Guatemala | 5.7 /100 | #226 | Tragic 35.3% |
| Mongolians | 5.7 /100 | #227 | Tragic 35.3% |
| Immigrants | Senegal | 5.5 /100 | #228 | Tragic 35.3% |
| Immigrants | Lebanon | 5.0 /100 | #229 | Tragic 35.2% |