Immigrants from Cuba vs Scottish In Labor Force | Age 20-24
COMPARE
Immigrants from Cuba
Scottish
In Labor Force | Age 20-24
In Labor Force | Age 20-24 Comparison
Immigrants from Cuba
Scottish
72.0%
IN LABOR FORCE | AGE 20-24
0.0/ 100
METRIC RATING
310th/ 347
METRIC RANK
77.4%
IN LABOR FORCE | AGE 20-24
100.0/ 100
METRIC RATING
40th/ 347
METRIC RANK
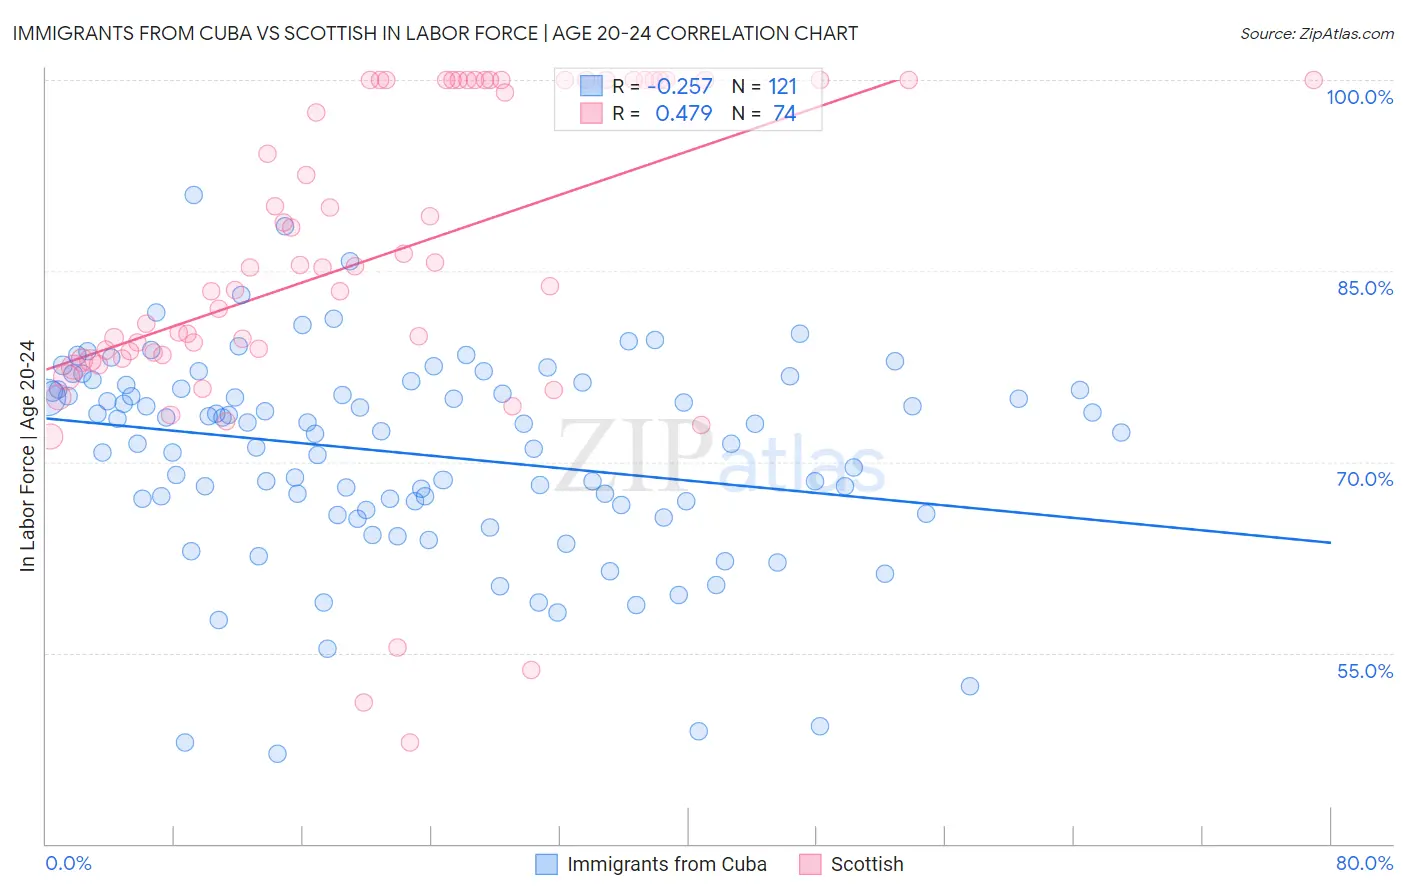
Immigrants from Cuba vs Scottish In Labor Force | Age 20-24 Correlation Chart
The statistical analysis conducted on geographies consisting of 325,873,529 people shows a weak negative correlation between the proportion of Immigrants from Cuba and labor force participation rate among population between the ages 20 and 24 in the United States with a correlation coefficient (R) of -0.257 and weighted average of 72.0%. Similarly, the statistical analysis conducted on geographies consisting of 565,643,510 people shows a moderate positive correlation between the proportion of Scottish and labor force participation rate among population between the ages 20 and 24 in the United States with a correlation coefficient (R) of 0.479 and weighted average of 77.4%, a difference of 7.5%.
In Labor Force | Age 20-24 Correlation Summary
| Measurement | Immigrants from Cuba | Scottish |
| Minimum | 47.0% | 47.9% |
| Maximum | 91.0% | 100.0% |
| Range | 43.9% | 52.1% |
| Mean | 70.6% | 85.9% |
| Median | 72.4% | 85.3% |
| Interquartile 25% (IQ1) | 66.4% | 78.4% |
| Interquartile 75% (IQ3) | 75.7% | 100.0% |
| Interquartile Range (IQR) | 9.3% | 21.6% |
| Standard Deviation (Sample) | 8.0% | 12.7% |
| Standard Deviation (Population) | 8.0% | 12.6% |
Similar Demographics by In Labor Force | Age 20-24
Demographics Similar to Immigrants from Cuba by In Labor Force | Age 20-24
In terms of in labor force | age 20-24, the demographic groups most similar to Immigrants from Cuba are Apache (72.0%, a difference of 0.010%), Immigrants from Caribbean (71.9%, a difference of 0.080%), Immigrants from Dominica (71.9%, a difference of 0.13%), Indian (Asian) (71.9%, a difference of 0.14%), and Immigrants from Iran (71.8%, a difference of 0.22%).
| Demographics | Rating | Rank | In Labor Force | Age 20-24 |
| Ecuadorians | 0.0 /100 | #303 | Tragic 72.4% |
| Immigrants | West Indies | 0.0 /100 | #304 | Tragic 72.4% |
| Immigrants | Singapore | 0.0 /100 | #305 | Tragic 72.4% |
| Immigrants | Jamaica | 0.0 /100 | #306 | Tragic 72.4% |
| Immigrants | Ecuador | 0.0 /100 | #307 | Tragic 72.3% |
| Soviet Union | 0.0 /100 | #308 | Tragic 72.3% |
| Tsimshian | 0.0 /100 | #309 | Tragic 72.3% |
| Immigrants | Cuba | 0.0 /100 | #310 | Tragic 72.0% |
| Apache | 0.0 /100 | #311 | Tragic 72.0% |
| Immigrants | Caribbean | 0.0 /100 | #312 | Tragic 71.9% |
| Immigrants | Dominica | 0.0 /100 | #313 | Tragic 71.9% |
| Indians (Asian) | 0.0 /100 | #314 | Tragic 71.9% |
| Immigrants | Iran | 0.0 /100 | #315 | Tragic 71.8% |
| Immigrants | Eastern Asia | 0.0 /100 | #316 | Tragic 71.8% |
| Immigrants | Armenia | 0.0 /100 | #317 | Tragic 71.7% |
Demographics Similar to Scottish by In Labor Force | Age 20-24
In terms of in labor force | age 20-24, the demographic groups most similar to Scottish are Immigrants from Congo (77.4%, a difference of 0.010%), Irish (77.4%, a difference of 0.030%), French (77.4%, a difference of 0.030%), Immigrants from Laos (77.4%, a difference of 0.030%), and Fijian (77.4%, a difference of 0.050%).
| Demographics | Rating | Rank | In Labor Force | Age 20-24 |
| Immigrants | Ethiopia | 100.0 /100 | #33 | Exceptional 77.5% |
| German Russians | 100.0 /100 | #34 | Exceptional 77.5% |
| Immigrants | Eastern Africa | 100.0 /100 | #35 | Exceptional 77.5% |
| Welsh | 100.0 /100 | #36 | Exceptional 77.5% |
| Czechoslovakians | 100.0 /100 | #37 | Exceptional 77.5% |
| Marshallese | 100.0 /100 | #38 | Exceptional 77.4% |
| Irish | 100.0 /100 | #39 | Exceptional 77.4% |
| Scottish | 100.0 /100 | #40 | Exceptional 77.4% |
| Immigrants | Congo | 100.0 /100 | #41 | Exceptional 77.4% |
| French | 100.0 /100 | #42 | Exceptional 77.4% |
| Immigrants | Laos | 100.0 /100 | #43 | Exceptional 77.4% |
| Fijians | 100.0 /100 | #44 | Exceptional 77.4% |
| Native Hawaiians | 100.0 /100 | #45 | Exceptional 77.4% |
| Samoans | 100.0 /100 | #46 | Exceptional 77.4% |
| Ethiopians | 100.0 /100 | #47 | Exceptional 77.3% |