Immigrants from Egypt vs Scottish In Labor Force | Age 20-24
COMPARE
Immigrants from Egypt
Scottish
In Labor Force | Age 20-24
In Labor Force | Age 20-24 Comparison
Immigrants from Egypt
Scottish
73.8%
IN LABOR FORCE | AGE 20-24
1.2/ 100
METRIC RATING
251st/ 347
METRIC RANK
77.4%
IN LABOR FORCE | AGE 20-24
100.0/ 100
METRIC RATING
40th/ 347
METRIC RANK
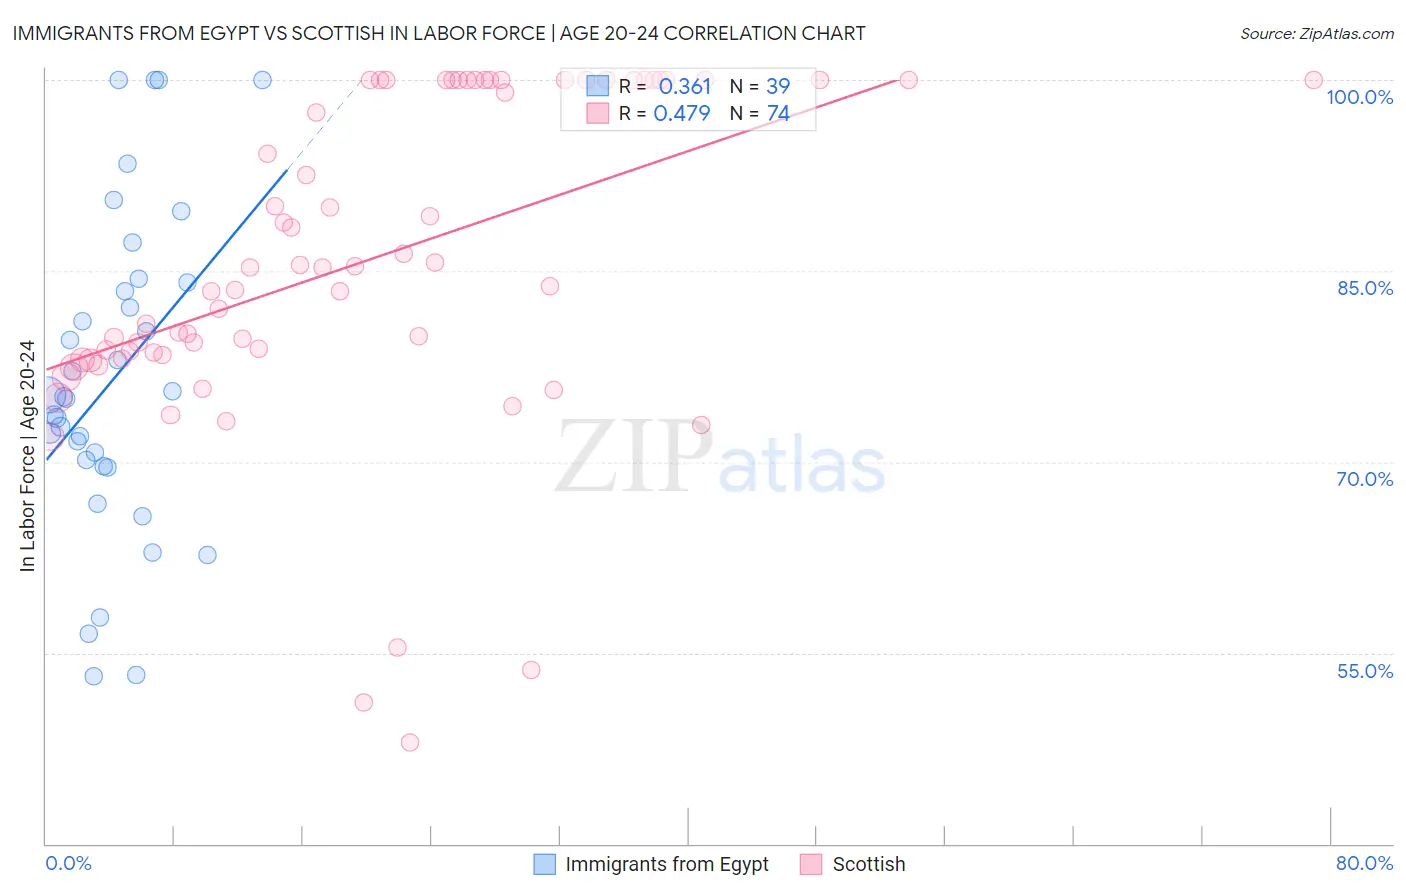
Immigrants from Egypt vs Scottish In Labor Force | Age 20-24 Correlation Chart
The statistical analysis conducted on geographies consisting of 245,464,045 people shows a mild positive correlation between the proportion of Immigrants from Egypt and labor force participation rate among population between the ages 20 and 24 in the United States with a correlation coefficient (R) of 0.361 and weighted average of 73.8%. Similarly, the statistical analysis conducted on geographies consisting of 565,643,510 people shows a moderate positive correlation between the proportion of Scottish and labor force participation rate among population between the ages 20 and 24 in the United States with a correlation coefficient (R) of 0.479 and weighted average of 77.4%, a difference of 4.8%.
In Labor Force | Age 20-24 Correlation Summary
| Measurement | Immigrants from Egypt | Scottish |
| Minimum | 53.2% | 47.9% |
| Maximum | 100.0% | 100.0% |
| Range | 46.8% | 52.1% |
| Mean | 76.6% | 85.9% |
| Median | 75.1% | 85.3% |
| Interquartile 25% (IQ1) | 69.7% | 78.4% |
| Interquartile 75% (IQ3) | 84.1% | 100.0% |
| Interquartile Range (IQR) | 14.4% | 21.6% |
| Standard Deviation (Sample) | 12.5% | 12.7% |
| Standard Deviation (Population) | 12.3% | 12.6% |
Similar Demographics by In Labor Force | Age 20-24
Demographics Similar to Immigrants from Egypt by In Labor Force | Age 20-24
In terms of in labor force | age 20-24, the demographic groups most similar to Immigrants from Egypt are Black/African American (73.9%, a difference of 0.020%), Immigrants from Belgium (73.9%, a difference of 0.020%), Immigrants from Kazakhstan (73.8%, a difference of 0.020%), Immigrants from Saudi Arabia (73.9%, a difference of 0.070%), and Arapaho (73.8%, a difference of 0.070%).
| Demographics | Rating | Rank | In Labor Force | Age 20-24 |
| Immigrants | South Central Asia | 1.9 /100 | #244 | Tragic 74.0% |
| Turks | 1.8 /100 | #245 | Tragic 73.9% |
| Immigrants | Panama | 1.6 /100 | #246 | Tragic 73.9% |
| Colville | 1.5 /100 | #247 | Tragic 73.9% |
| Immigrants | Saudi Arabia | 1.5 /100 | #248 | Tragic 73.9% |
| Blacks/African Americans | 1.3 /100 | #249 | Tragic 73.9% |
| Immigrants | Belgium | 1.3 /100 | #250 | Tragic 73.9% |
| Immigrants | Egypt | 1.2 /100 | #251 | Tragic 73.8% |
| Immigrants | Kazakhstan | 1.1 /100 | #252 | Tragic 73.8% |
| Arapaho | 1.0 /100 | #253 | Tragic 73.8% |
| Ute | 1.0 /100 | #254 | Tragic 73.8% |
| Immigrants | Pakistan | 0.9 /100 | #255 | Tragic 73.8% |
| Spanish American Indians | 0.8 /100 | #256 | Tragic 73.7% |
| Paraguayans | 0.8 /100 | #257 | Tragic 73.7% |
| Egyptians | 0.7 /100 | #258 | Tragic 73.7% |
Demographics Similar to Scottish by In Labor Force | Age 20-24
In terms of in labor force | age 20-24, the demographic groups most similar to Scottish are Immigrants from Congo (77.4%, a difference of 0.010%), Irish (77.4%, a difference of 0.030%), French (77.4%, a difference of 0.030%), Immigrants from Laos (77.4%, a difference of 0.030%), and Fijian (77.4%, a difference of 0.050%).
| Demographics | Rating | Rank | In Labor Force | Age 20-24 |
| Immigrants | Ethiopia | 100.0 /100 | #33 | Exceptional 77.5% |
| German Russians | 100.0 /100 | #34 | Exceptional 77.5% |
| Immigrants | Eastern Africa | 100.0 /100 | #35 | Exceptional 77.5% |
| Welsh | 100.0 /100 | #36 | Exceptional 77.5% |
| Czechoslovakians | 100.0 /100 | #37 | Exceptional 77.5% |
| Marshallese | 100.0 /100 | #38 | Exceptional 77.4% |
| Irish | 100.0 /100 | #39 | Exceptional 77.4% |
| Scottish | 100.0 /100 | #40 | Exceptional 77.4% |
| Immigrants | Congo | 100.0 /100 | #41 | Exceptional 77.4% |
| French | 100.0 /100 | #42 | Exceptional 77.4% |
| Immigrants | Laos | 100.0 /100 | #43 | Exceptional 77.4% |
| Fijians | 100.0 /100 | #44 | Exceptional 77.4% |
| Native Hawaiians | 100.0 /100 | #45 | Exceptional 77.4% |
| Samoans | 100.0 /100 | #46 | Exceptional 77.4% |
| Ethiopians | 100.0 /100 | #47 | Exceptional 77.3% |