Liberian vs Immigrants from Philippines In Labor Force | Age 20-24
COMPARE
Liberian
Immigrants from Philippines
In Labor Force | Age 20-24
In Labor Force | Age 20-24 Comparison
Liberians
Immigrants from Philippines
78.0%
IN LABOR FORCE | AGE 20-24
100.0/ 100
METRIC RATING
24th/ 347
METRIC RANK
75.1%
IN LABOR FORCE | AGE 20-24
55.8/ 100
METRIC RATING
169th/ 347
METRIC RANK
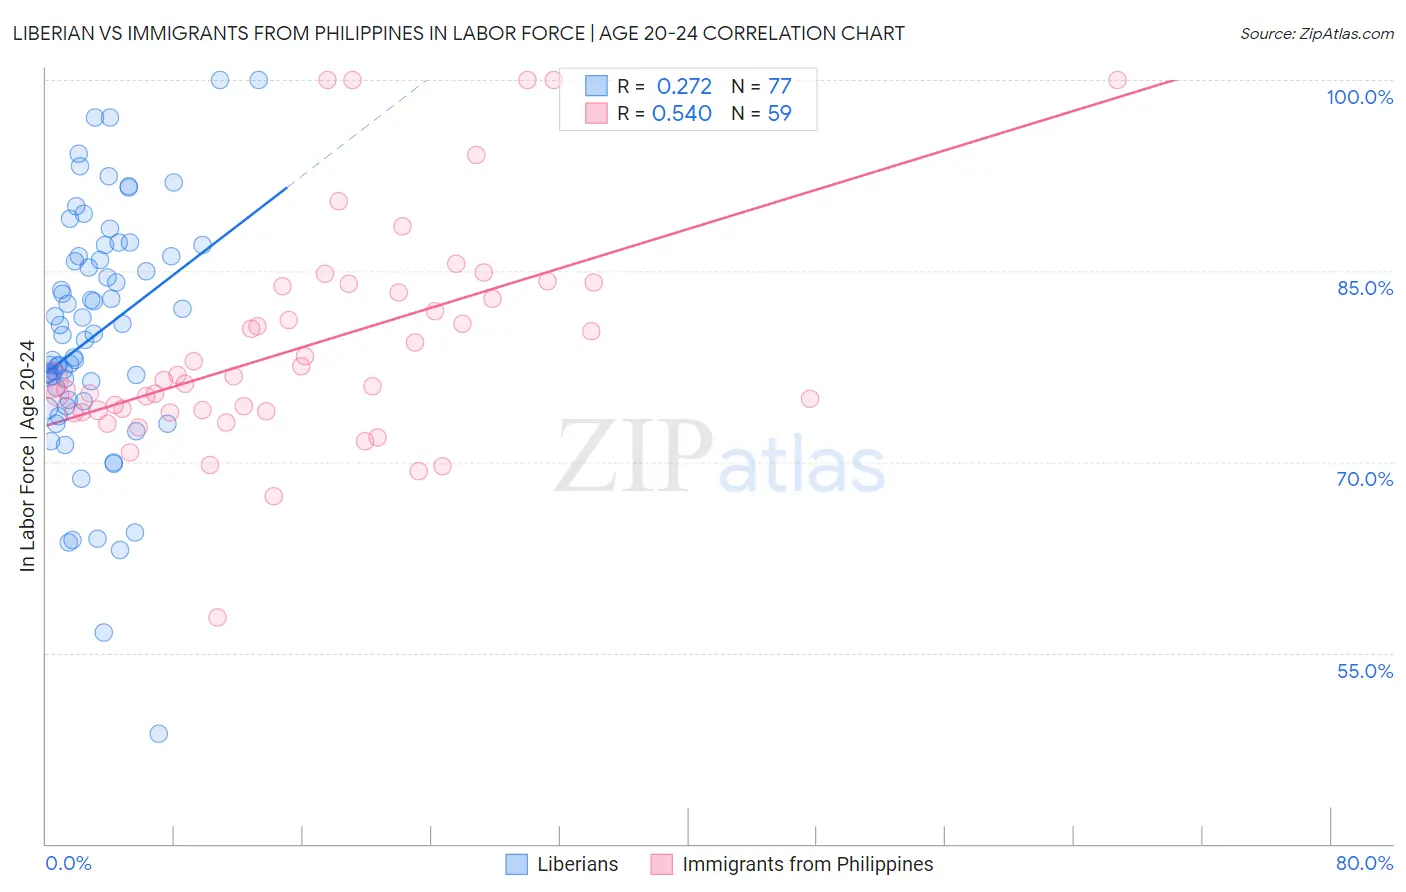
Liberian vs Immigrants from Philippines In Labor Force | Age 20-24 Correlation Chart
The statistical analysis conducted on geographies consisting of 118,080,661 people shows a weak positive correlation between the proportion of Liberians and labor force participation rate among population between the ages 20 and 24 in the United States with a correlation coefficient (R) of 0.272 and weighted average of 78.0%. Similarly, the statistical analysis conducted on geographies consisting of 470,994,920 people shows a substantial positive correlation between the proportion of Immigrants from Philippines and labor force participation rate among population between the ages 20 and 24 in the United States with a correlation coefficient (R) of 0.540 and weighted average of 75.1%, a difference of 3.8%.
In Labor Force | Age 20-24 Correlation Summary
| Measurement | Liberian | Immigrants from Philippines |
| Minimum | 48.6% | 57.8% |
| Maximum | 100.0% | 100.0% |
| Range | 51.4% | 42.2% |
| Mean | 80.0% | 79.2% |
| Median | 80.0% | 76.5% |
| Interquartile 25% (IQ1) | 74.8% | 74.0% |
| Interquartile 75% (IQ3) | 86.2% | 83.8% |
| Interquartile Range (IQR) | 11.4% | 9.8% |
| Standard Deviation (Sample) | 9.6% | 8.7% |
| Standard Deviation (Population) | 9.5% | 8.6% |
Similar Demographics by In Labor Force | Age 20-24
Demographics Similar to Liberians by In Labor Force | Age 20-24
In terms of in labor force | age 20-24, the demographic groups most similar to Liberians are Yugoslavian (78.0%, a difference of 0.0%), Pennsylvania German (78.0%, a difference of 0.010%), Tlingit-Haida (77.9%, a difference of 0.040%), Tongan (77.9%, a difference of 0.060%), and Puget Sound Salish (78.0%, a difference of 0.070%).
| Demographics | Rating | Rank | In Labor Force | Age 20-24 |
| Cape Verdeans | 100.0 /100 | #17 | Exceptional 78.3% |
| Immigrants | Bosnia and Herzegovina | 100.0 /100 | #18 | Exceptional 78.1% |
| Bangladeshis | 100.0 /100 | #19 | Exceptional 78.1% |
| French Canadians | 100.0 /100 | #20 | Exceptional 78.1% |
| Puget Sound Salish | 100.0 /100 | #21 | Exceptional 78.0% |
| Pennsylvania Germans | 100.0 /100 | #22 | Exceptional 78.0% |
| Yugoslavians | 100.0 /100 | #23 | Exceptional 78.0% |
| Liberians | 100.0 /100 | #24 | Exceptional 78.0% |
| Tlingit-Haida | 100.0 /100 | #25 | Exceptional 77.9% |
| Tongans | 100.0 /100 | #26 | Exceptional 77.9% |
| Immigrants | Micronesia | 100.0 /100 | #27 | Exceptional 77.8% |
| Belgians | 100.0 /100 | #28 | Exceptional 77.8% |
| Slovaks | 100.0 /100 | #29 | Exceptional 77.7% |
| Swiss | 100.0 /100 | #30 | Exceptional 77.7% |
| Poles | 100.0 /100 | #31 | Exceptional 77.6% |
Demographics Similar to Immigrants from Philippines by In Labor Force | Age 20-24
In terms of in labor force | age 20-24, the demographic groups most similar to Immigrants from Philippines are Immigrants from Western Africa (75.1%, a difference of 0.010%), Immigrants from South Eastern Asia (75.1%, a difference of 0.030%), Mexican (75.1%, a difference of 0.050%), Cambodian (75.2%, a difference of 0.070%), and Cajun (75.1%, a difference of 0.070%).
| Demographics | Rating | Rank | In Labor Force | Age 20-24 |
| Immigrants | Romania | 64.6 /100 | #162 | Good 75.2% |
| Costa Ricans | 64.2 /100 | #163 | Good 75.2% |
| Bolivians | 64.0 /100 | #164 | Good 75.2% |
| Afghans | 63.5 /100 | #165 | Good 75.2% |
| Cambodians | 60.5 /100 | #166 | Good 75.2% |
| Immigrants | South Eastern Asia | 57.5 /100 | #167 | Average 75.1% |
| Immigrants | Western Africa | 56.7 /100 | #168 | Average 75.1% |
| Immigrants | Philippines | 55.8 /100 | #169 | Average 75.1% |
| Mexicans | 52.1 /100 | #170 | Average 75.1% |
| Cajuns | 51.1 /100 | #171 | Average 75.1% |
| Yakama | 50.8 /100 | #172 | Average 75.1% |
| Immigrants | Croatia | 50.2 /100 | #173 | Average 75.1% |
| South Africans | 50.0 /100 | #174 | Average 75.0% |
| Syrians | 49.5 /100 | #175 | Average 75.0% |
| Central Americans | 48.7 /100 | #176 | Average 75.0% |