Sioux vs Immigrants from Philippines In Labor Force | Age 20-24
COMPARE
Sioux
Immigrants from Philippines
In Labor Force | Age 20-24
In Labor Force | Age 20-24 Comparison
Sioux
Immigrants from Philippines
74.6%
IN LABOR FORCE | AGE 20-24
17.5/ 100
METRIC RATING
206th/ 347
METRIC RANK
75.1%
IN LABOR FORCE | AGE 20-24
55.8/ 100
METRIC RATING
169th/ 347
METRIC RANK
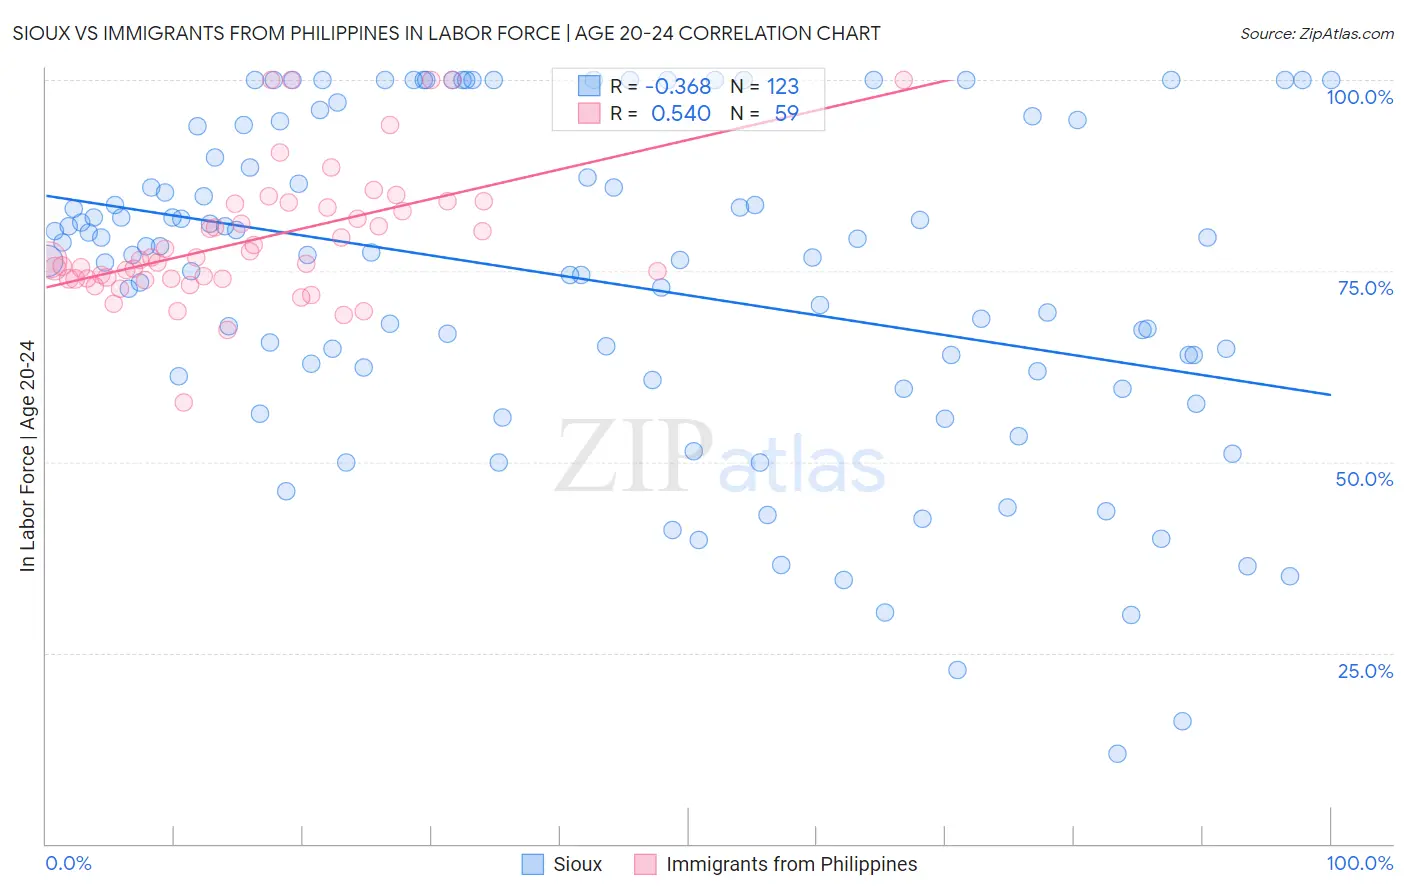
Sioux vs Immigrants from Philippines In Labor Force | Age 20-24 Correlation Chart
The statistical analysis conducted on geographies consisting of 234,099,226 people shows a mild negative correlation between the proportion of Sioux and labor force participation rate among population between the ages 20 and 24 in the United States with a correlation coefficient (R) of -0.368 and weighted average of 74.6%. Similarly, the statistical analysis conducted on geographies consisting of 470,994,920 people shows a substantial positive correlation between the proportion of Immigrants from Philippines and labor force participation rate among population between the ages 20 and 24 in the United States with a correlation coefficient (R) of 0.540 and weighted average of 75.1%, a difference of 0.66%.
In Labor Force | Age 20-24 Correlation Summary
| Measurement | Sioux | Immigrants from Philippines |
| Minimum | 11.8% | 57.8% |
| Maximum | 100.0% | 100.0% |
| Range | 88.2% | 42.2% |
| Mean | 73.8% | 79.2% |
| Median | 77.4% | 76.5% |
| Interquartile 25% (IQ1) | 61.2% | 74.0% |
| Interquartile 75% (IQ3) | 93.9% | 83.8% |
| Interquartile Range (IQR) | 32.7% | 9.8% |
| Standard Deviation (Sample) | 21.4% | 8.7% |
| Standard Deviation (Population) | 21.3% | 8.6% |
Similar Demographics by In Labor Force | Age 20-24
Demographics Similar to Sioux by In Labor Force | Age 20-24
In terms of in labor force | age 20-24, the demographic groups most similar to Sioux are Immigrants from Italy (74.6%, a difference of 0.0%), Inupiat (74.6%, a difference of 0.0%), Immigrants from Northern Africa (74.6%, a difference of 0.010%), Albanian (74.6%, a difference of 0.030%), and Immigrants from Uruguay (74.6%, a difference of 0.040%).
| Demographics | Rating | Rank | In Labor Force | Age 20-24 |
| Taiwanese | 23.2 /100 | #199 | Fair 74.7% |
| Nigerians | 21.9 /100 | #200 | Fair 74.7% |
| Choctaw | 21.4 /100 | #201 | Fair 74.7% |
| Moroccans | 20.4 /100 | #202 | Fair 74.7% |
| Immigrants | Northern Africa | 17.9 /100 | #203 | Poor 74.6% |
| Immigrants | Italy | 17.6 /100 | #204 | Poor 74.6% |
| Inupiat | 17.6 /100 | #205 | Poor 74.6% |
| Sioux | 17.5 /100 | #206 | Poor 74.6% |
| Albanians | 16.2 /100 | #207 | Poor 74.6% |
| Immigrants | Uruguay | 15.8 /100 | #208 | Poor 74.6% |
| Arabs | 15.8 /100 | #209 | Poor 74.6% |
| Uruguayans | 15.1 /100 | #210 | Poor 74.6% |
| Immigrants | Australia | 14.7 /100 | #211 | Poor 74.6% |
| Creek | 13.3 /100 | #212 | Poor 74.5% |
| Peruvians | 13.3 /100 | #213 | Poor 74.5% |
Demographics Similar to Immigrants from Philippines by In Labor Force | Age 20-24
In terms of in labor force | age 20-24, the demographic groups most similar to Immigrants from Philippines are Immigrants from Western Africa (75.1%, a difference of 0.010%), Immigrants from South Eastern Asia (75.1%, a difference of 0.030%), Mexican (75.1%, a difference of 0.050%), Cambodian (75.2%, a difference of 0.070%), and Cajun (75.1%, a difference of 0.070%).
| Demographics | Rating | Rank | In Labor Force | Age 20-24 |
| Immigrants | Romania | 64.6 /100 | #162 | Good 75.2% |
| Costa Ricans | 64.2 /100 | #163 | Good 75.2% |
| Bolivians | 64.0 /100 | #164 | Good 75.2% |
| Afghans | 63.5 /100 | #165 | Good 75.2% |
| Cambodians | 60.5 /100 | #166 | Good 75.2% |
| Immigrants | South Eastern Asia | 57.5 /100 | #167 | Average 75.1% |
| Immigrants | Western Africa | 56.7 /100 | #168 | Average 75.1% |
| Immigrants | Philippines | 55.8 /100 | #169 | Average 75.1% |
| Mexicans | 52.1 /100 | #170 | Average 75.1% |
| Cajuns | 51.1 /100 | #171 | Average 75.1% |
| Yakama | 50.8 /100 | #172 | Average 75.1% |
| Immigrants | Croatia | 50.2 /100 | #173 | Average 75.1% |
| South Africans | 50.0 /100 | #174 | Average 75.0% |
| Syrians | 49.5 /100 | #175 | Average 75.0% |
| Central Americans | 48.7 /100 | #176 | Average 75.0% |