British vs Yuman In Labor Force | Age 25-29
COMPARE
British
Yuman
In Labor Force | Age 25-29
In Labor Force | Age 25-29 Comparison
British
Yuman
84.7%
IN LABOR FORCE | AGE 25-29
60.4/ 100
METRIC RATING
157th/ 347
METRIC RANK
79.3%
IN LABOR FORCE | AGE 25-29
0.0/ 100
METRIC RATING
334th/ 347
METRIC RANK
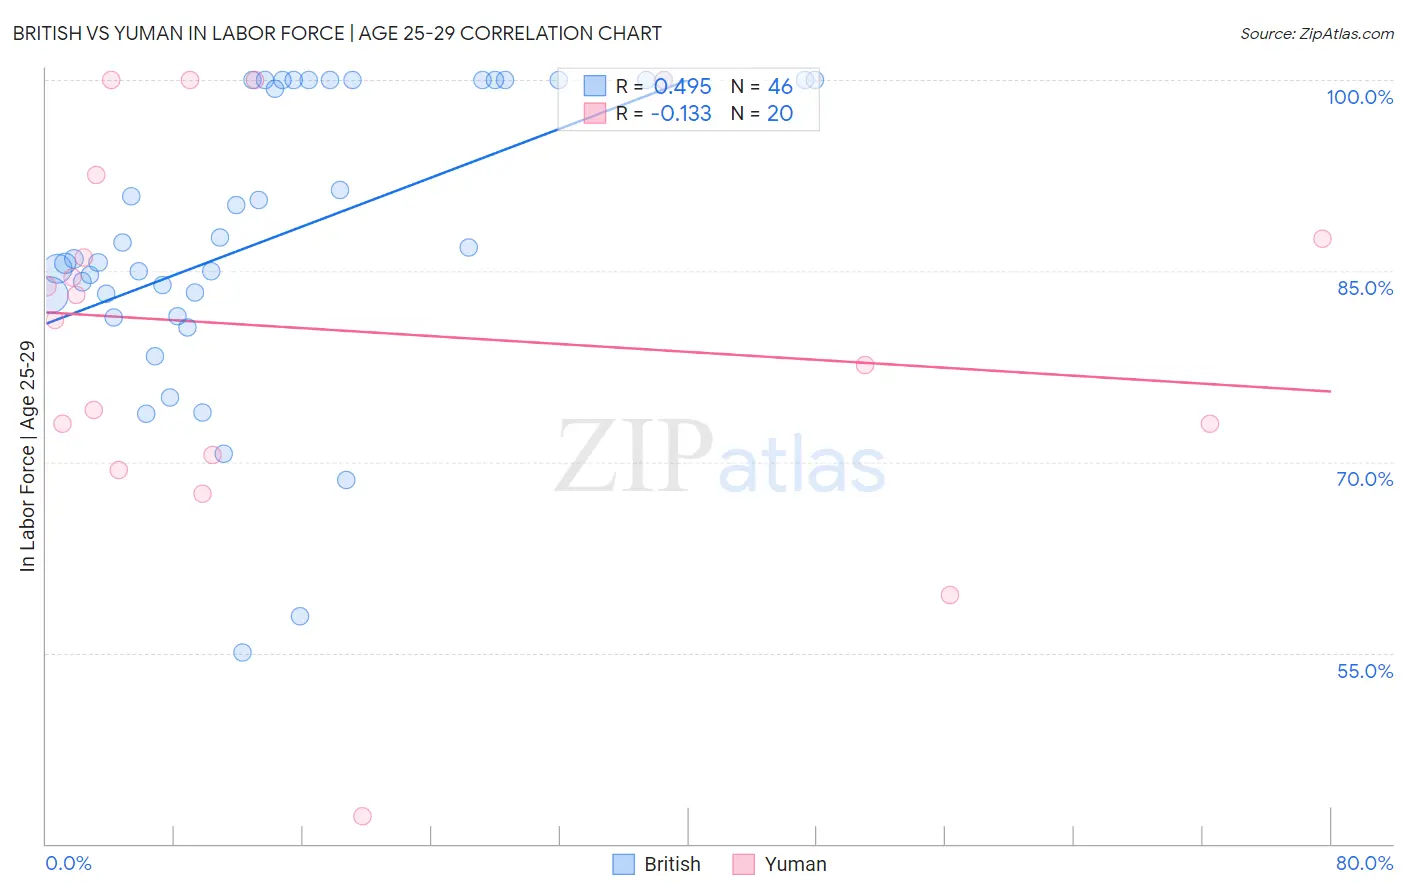
British vs Yuman In Labor Force | Age 25-29 Correlation Chart
The statistical analysis conducted on geographies consisting of 530,868,549 people shows a moderate positive correlation between the proportion of British and labor force participation rate among population between the ages 25 and 29 in the United States with a correlation coefficient (R) of 0.495 and weighted average of 84.7%. Similarly, the statistical analysis conducted on geographies consisting of 40,683,132 people shows a poor negative correlation between the proportion of Yuman and labor force participation rate among population between the ages 25 and 29 in the United States with a correlation coefficient (R) of -0.133 and weighted average of 79.3%, a difference of 6.8%.
In Labor Force | Age 25-29 Correlation Summary
| Measurement | British | Yuman |
| Minimum | 55.0% | 42.2% |
| Maximum | 100.0% | 100.0% |
| Range | 45.0% | 57.8% |
| Mean | 87.7% | 80.3% |
| Median | 86.4% | 82.1% |
| Interquartile 25% (IQ1) | 83.1% | 71.7% |
| Interquartile 75% (IQ3) | 100.0% | 90.0% |
| Interquartile Range (IQR) | 16.9% | 18.3% |
| Standard Deviation (Sample) | 11.5% | 14.9% |
| Standard Deviation (Population) | 11.4% | 14.6% |
Similar Demographics by In Labor Force | Age 25-29
Demographics Similar to British by In Labor Force | Age 25-29
In terms of in labor force | age 25-29, the demographic groups most similar to British are French (84.7%, a difference of 0.0%), Immigrants from Ghana (84.7%, a difference of 0.0%), Immigrants from Western Africa (84.7%, a difference of 0.0%), Immigrants from Taiwan (84.7%, a difference of 0.010%), and Immigrants from Sri Lanka (84.7%, a difference of 0.010%).
| Demographics | Rating | Rank | In Labor Force | Age 25-29 |
| Swiss | 64.7 /100 | #150 | Good 84.7% |
| Colombians | 62.8 /100 | #151 | Good 84.7% |
| Immigrants | Pakistan | 62.7 /100 | #152 | Good 84.7% |
| Immigrants | Taiwan | 62.2 /100 | #153 | Good 84.7% |
| Immigrants | Sri Lanka | 61.7 /100 | #154 | Good 84.7% |
| Indians (Asian) | 61.6 /100 | #155 | Good 84.7% |
| French | 61.0 /100 | #156 | Good 84.7% |
| British | 60.4 /100 | #157 | Good 84.7% |
| Immigrants | Ghana | 60.2 /100 | #158 | Good 84.7% |
| Immigrants | Western Africa | 60.1 /100 | #159 | Good 84.7% |
| Immigrants | Peru | 58.6 /100 | #160 | Average 84.7% |
| Canadians | 58.5 /100 | #161 | Average 84.7% |
| Immigrants | Colombia | 58.3 /100 | #162 | Average 84.7% |
| Argentineans | 57.9 /100 | #163 | Average 84.7% |
| Ghanaians | 57.6 /100 | #164 | Average 84.7% |
Demographics Similar to Yuman by In Labor Force | Age 25-29
In terms of in labor force | age 25-29, the demographic groups most similar to Yuman are Native/Alaskan (79.3%, a difference of 0.080%), Apache (79.2%, a difference of 0.16%), Sioux (79.7%, a difference of 0.42%), Inupiat (79.8%, a difference of 0.53%), and Crow (78.6%, a difference of 0.91%).
| Demographics | Rating | Rank | In Labor Force | Age 25-29 |
| Ute | 0.0 /100 | #327 | Tragic 80.8% |
| Creek | 0.0 /100 | #328 | Tragic 80.7% |
| Yakama | 0.0 /100 | #329 | Tragic 80.6% |
| Puerto Ricans | 0.0 /100 | #330 | Tragic 80.4% |
| Cheyenne | 0.0 /100 | #331 | Tragic 80.3% |
| Inupiat | 0.0 /100 | #332 | Tragic 79.8% |
| Sioux | 0.0 /100 | #333 | Tragic 79.7% |
| Yuman | 0.0 /100 | #334 | Tragic 79.3% |
| Natives/Alaskans | 0.0 /100 | #335 | Tragic 79.3% |
| Apache | 0.0 /100 | #336 | Tragic 79.2% |
| Crow | 0.0 /100 | #337 | Tragic 78.6% |
| Lumbee | 0.0 /100 | #338 | Tragic 78.3% |
| Immigrants | Yemen | 0.0 /100 | #339 | Tragic 78.2% |
| Paiute | 0.0 /100 | #340 | Tragic 78.1% |
| Tohono O'odham | 0.0 /100 | #341 | Tragic 77.5% |