British vs Scotch-Irish In Labor Force | Age 35-44
COMPARE
British
Scotch-Irish
In Labor Force | Age 35-44
In Labor Force | Age 35-44 Comparison
British
Scotch-Irish
84.2%
IN LABOR FORCE | AGE 35-44
23.0/ 100
METRIC RATING
201st/ 347
METRIC RANK
83.5%
IN LABOR FORCE | AGE 35-44
0.1/ 100
METRIC RATING
264th/ 347
METRIC RANK
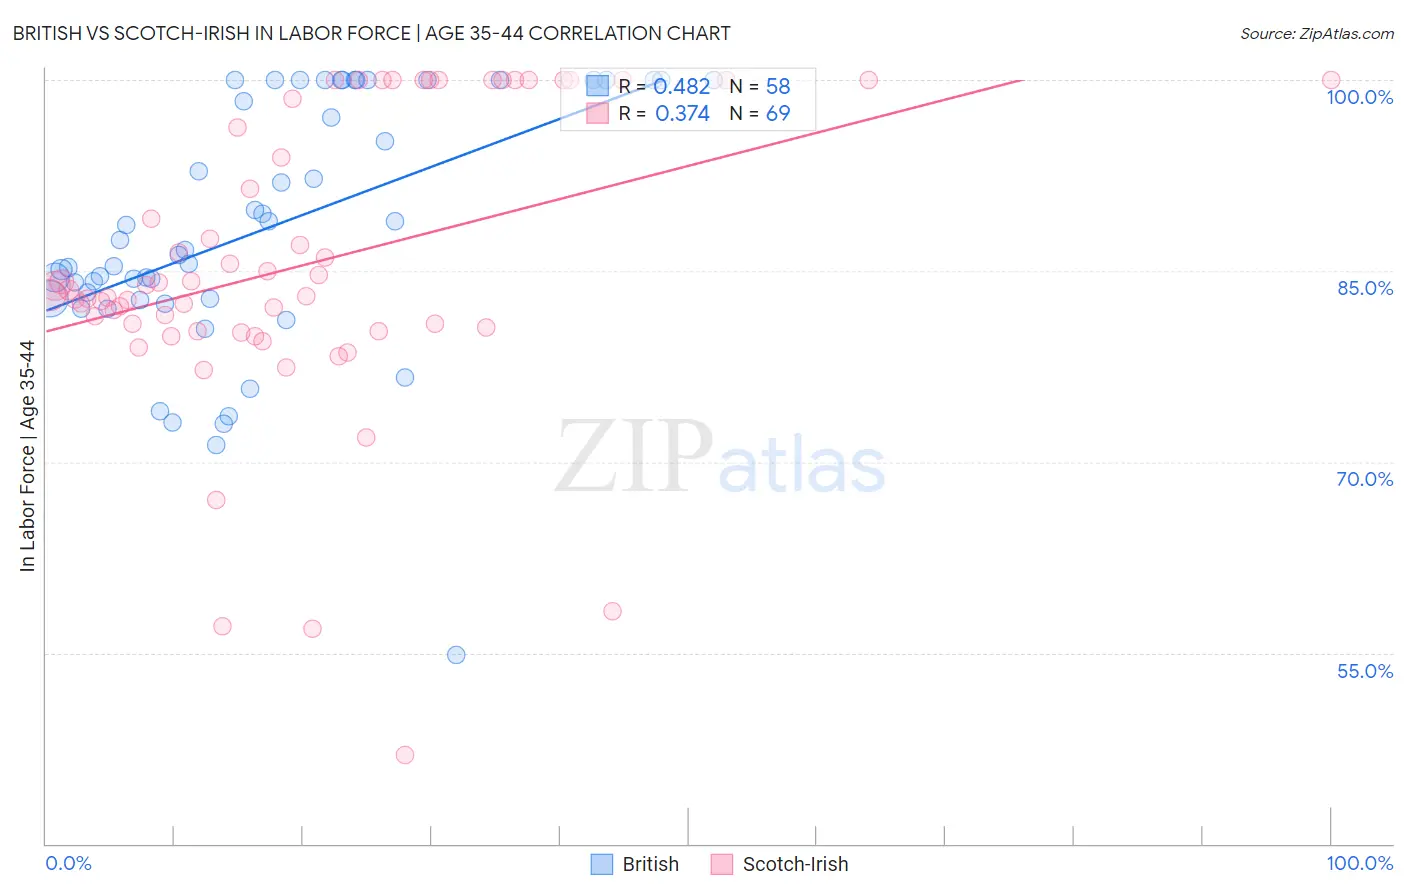
British vs Scotch-Irish In Labor Force | Age 35-44 Correlation Chart
The statistical analysis conducted on geographies consisting of 531,027,456 people shows a moderate positive correlation between the proportion of British and labor force participation rate among population between the ages 35 and 44 in the United States with a correlation coefficient (R) of 0.482 and weighted average of 84.2%. Similarly, the statistical analysis conducted on geographies consisting of 548,325,894 people shows a mild positive correlation between the proportion of Scotch-Irish and labor force participation rate among population between the ages 35 and 44 in the United States with a correlation coefficient (R) of 0.374 and weighted average of 83.5%, a difference of 0.89%.
In Labor Force | Age 35-44 Correlation Summary
| Measurement | British | Scotch-Irish |
| Minimum | 54.8% | 47.0% |
| Maximum | 100.0% | 100.0% |
| Range | 45.2% | 53.0% |
| Mean | 88.2% | 85.5% |
| Median | 86.4% | 83.5% |
| Interquartile 25% (IQ1) | 82.8% | 80.4% |
| Interquartile 75% (IQ3) | 100.0% | 99.3% |
| Interquartile Range (IQR) | 17.2% | 18.8% |
| Standard Deviation (Sample) | 9.9% | 11.5% |
| Standard Deviation (Population) | 9.8% | 11.4% |
Similar Demographics by In Labor Force | Age 35-44
Demographics Similar to British by In Labor Force | Age 35-44
In terms of in labor force | age 35-44, the demographic groups most similar to British are Syrian (84.2%, a difference of 0.0%), Moroccan (84.2%, a difference of 0.0%), Immigrants from Uzbekistan (84.2%, a difference of 0.0%), Ecuadorian (84.2%, a difference of 0.010%), and Immigrants from South Eastern Asia (84.2%, a difference of 0.010%).
| Demographics | Rating | Rank | In Labor Force | Age 35-44 |
| Immigrants | Indonesia | 25.7 /100 | #194 | Fair 84.2% |
| Immigrants | Caribbean | 25.7 /100 | #195 | Fair 84.2% |
| Immigrants | England | 25.0 /100 | #196 | Fair 84.2% |
| Immigrants | Western Europe | 24.7 /100 | #197 | Fair 84.2% |
| Ecuadorians | 24.0 /100 | #198 | Fair 84.2% |
| Syrians | 23.2 /100 | #199 | Fair 84.2% |
| Moroccans | 23.2 /100 | #200 | Fair 84.2% |
| British | 23.0 /100 | #201 | Fair 84.2% |
| Immigrants | Uzbekistan | 22.8 /100 | #202 | Fair 84.2% |
| Immigrants | South Eastern Asia | 22.4 /100 | #203 | Fair 84.2% |
| Canadians | 19.9 /100 | #204 | Poor 84.2% |
| Immigrants | Canada | 19.6 /100 | #205 | Poor 84.2% |
| Immigrants | Costa Rica | 19.5 /100 | #206 | Poor 84.2% |
| Laotians | 19.0 /100 | #207 | Poor 84.2% |
| Immigrants | North America | 18.1 /100 | #208 | Poor 84.2% |
Demographics Similar to Scotch-Irish by In Labor Force | Age 35-44
In terms of in labor force | age 35-44, the demographic groups most similar to Scotch-Irish are Central American (83.5%, a difference of 0.010%), Iroquois (83.5%, a difference of 0.030%), Spaniard (83.4%, a difference of 0.040%), Immigrants from Congo (83.5%, a difference of 0.060%), and Vietnamese (83.5%, a difference of 0.070%).
| Demographics | Rating | Rank | In Labor Force | Age 35-44 |
| Basques | 0.3 /100 | #257 | Tragic 83.6% |
| Tsimshian | 0.2 /100 | #258 | Tragic 83.5% |
| Immigrants | El Salvador | 0.2 /100 | #259 | Tragic 83.5% |
| Vietnamese | 0.2 /100 | #260 | Tragic 83.5% |
| Immigrants | Dominica | 0.2 /100 | #261 | Tragic 83.5% |
| Immigrants | Congo | 0.2 /100 | #262 | Tragic 83.5% |
| Iroquois | 0.2 /100 | #263 | Tragic 83.5% |
| Scotch-Irish | 0.1 /100 | #264 | Tragic 83.5% |
| Central Americans | 0.1 /100 | #265 | Tragic 83.5% |
| Spaniards | 0.1 /100 | #266 | Tragic 83.4% |
| Guamanians/Chamorros | 0.1 /100 | #267 | Tragic 83.4% |
| Hondurans | 0.1 /100 | #268 | Tragic 83.4% |
| Immigrants | Grenada | 0.1 /100 | #269 | Tragic 83.3% |
| Immigrants | Honduras | 0.0 /100 | #270 | Tragic 83.3% |
| French American Indians | 0.0 /100 | #271 | Tragic 83.2% |