British vs Alaska Native In Labor Force | Age 35-44
COMPARE
British
Alaska Native
In Labor Force | Age 35-44
In Labor Force | Age 35-44 Comparison
British
Alaska Natives
84.2%
IN LABOR FORCE | AGE 35-44
23.0/ 100
METRIC RATING
201st/ 347
METRIC RANK
81.6%
IN LABOR FORCE | AGE 35-44
0.0/ 100
METRIC RATING
312th/ 347
METRIC RANK
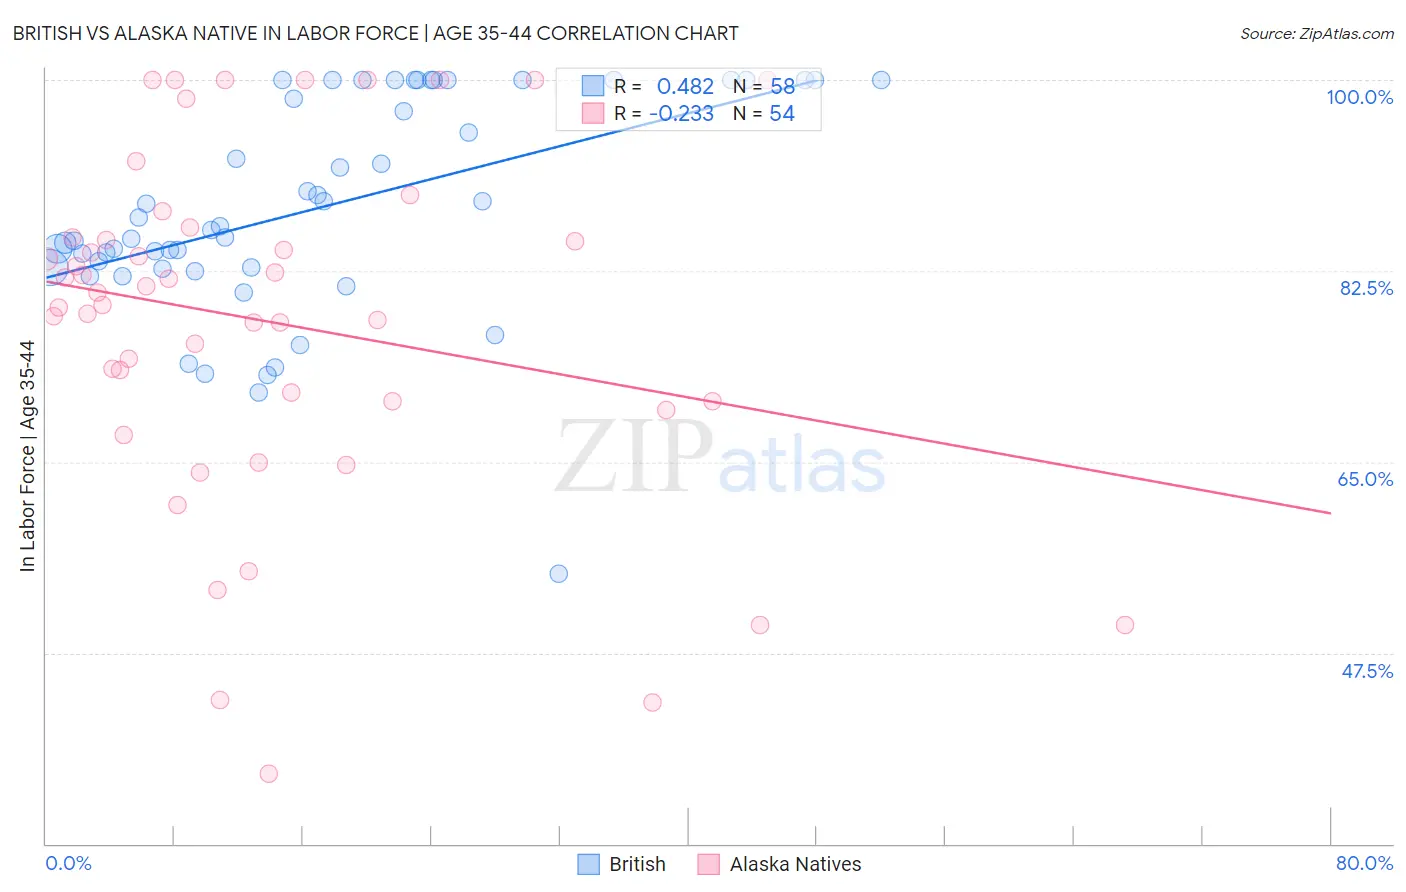
British vs Alaska Native In Labor Force | Age 35-44 Correlation Chart
The statistical analysis conducted on geographies consisting of 531,027,456 people shows a moderate positive correlation between the proportion of British and labor force participation rate among population between the ages 35 and 44 in the United States with a correlation coefficient (R) of 0.482 and weighted average of 84.2%. Similarly, the statistical analysis conducted on geographies consisting of 76,764,235 people shows a weak negative correlation between the proportion of Alaska Natives and labor force participation rate among population between the ages 35 and 44 in the United States with a correlation coefficient (R) of -0.233 and weighted average of 81.6%, a difference of 3.2%.
In Labor Force | Age 35-44 Correlation Summary
| Measurement | British | Alaska Native |
| Minimum | 54.8% | 36.4% |
| Maximum | 100.0% | 100.0% |
| Range | 45.2% | 63.6% |
| Mean | 88.2% | 77.8% |
| Median | 86.4% | 79.9% |
| Interquartile 25% (IQ1) | 82.8% | 70.5% |
| Interquartile 75% (IQ3) | 100.0% | 85.5% |
| Interquartile Range (IQR) | 17.2% | 15.0% |
| Standard Deviation (Sample) | 9.9% | 15.9% |
| Standard Deviation (Population) | 9.8% | 15.7% |
Similar Demographics by In Labor Force | Age 35-44
Demographics Similar to British by In Labor Force | Age 35-44
In terms of in labor force | age 35-44, the demographic groups most similar to British are Syrian (84.2%, a difference of 0.0%), Moroccan (84.2%, a difference of 0.0%), Immigrants from Uzbekistan (84.2%, a difference of 0.0%), Ecuadorian (84.2%, a difference of 0.010%), and Immigrants from South Eastern Asia (84.2%, a difference of 0.010%).
| Demographics | Rating | Rank | In Labor Force | Age 35-44 |
| Immigrants | Indonesia | 25.7 /100 | #194 | Fair 84.2% |
| Immigrants | Caribbean | 25.7 /100 | #195 | Fair 84.2% |
| Immigrants | England | 25.0 /100 | #196 | Fair 84.2% |
| Immigrants | Western Europe | 24.7 /100 | #197 | Fair 84.2% |
| Ecuadorians | 24.0 /100 | #198 | Fair 84.2% |
| Syrians | 23.2 /100 | #199 | Fair 84.2% |
| Moroccans | 23.2 /100 | #200 | Fair 84.2% |
| British | 23.0 /100 | #201 | Fair 84.2% |
| Immigrants | Uzbekistan | 22.8 /100 | #202 | Fair 84.2% |
| Immigrants | South Eastern Asia | 22.4 /100 | #203 | Fair 84.2% |
| Canadians | 19.9 /100 | #204 | Poor 84.2% |
| Immigrants | Canada | 19.6 /100 | #205 | Poor 84.2% |
| Immigrants | Costa Rica | 19.5 /100 | #206 | Poor 84.2% |
| Laotians | 19.0 /100 | #207 | Poor 84.2% |
| Immigrants | North America | 18.1 /100 | #208 | Poor 84.2% |
Demographics Similar to Alaska Natives by In Labor Force | Age 35-44
In terms of in labor force | age 35-44, the demographic groups most similar to Alaska Natives are Mexican (81.6%, a difference of 0.0%), Cajun (81.5%, a difference of 0.12%), Colville (81.7%, a difference of 0.14%), Immigrants from Mexico (81.5%, a difference of 0.14%), and Comanche (81.5%, a difference of 0.16%).
| Demographics | Rating | Rank | In Labor Force | Age 35-44 |
| Shoshone | 0.0 /100 | #305 | Tragic 82.2% |
| Blacks/African Americans | 0.0 /100 | #306 | Tragic 82.2% |
| Hispanics or Latinos | 0.0 /100 | #307 | Tragic 82.1% |
| Immigrants | Central America | 0.0 /100 | #308 | Tragic 82.0% |
| Cree | 0.0 /100 | #309 | Tragic 82.0% |
| Blackfeet | 0.0 /100 | #310 | Tragic 81.9% |
| Colville | 0.0 /100 | #311 | Tragic 81.7% |
| Alaska Natives | 0.0 /100 | #312 | Tragic 81.6% |
| Mexicans | 0.0 /100 | #313 | Tragic 81.6% |
| Cajuns | 0.0 /100 | #314 | Tragic 81.5% |
| Immigrants | Mexico | 0.0 /100 | #315 | Tragic 81.5% |
| Comanche | 0.0 /100 | #316 | Tragic 81.5% |
| Cherokee | 0.0 /100 | #317 | Tragic 81.4% |
| Alaskan Athabascans | 0.0 /100 | #318 | Tragic 81.3% |
| Inupiat | 0.0 /100 | #319 | Tragic 80.9% |