Immigrants from Kazakhstan vs Iranian In Labor Force | Age 16-19
COMPARE
Immigrants from Kazakhstan
Iranian
In Labor Force | Age 16-19
In Labor Force | Age 16-19 Comparison
Immigrants from Kazakhstan
Iranians
35.2%
IN LABOR FORCE | AGE 16-19
4.5/ 100
METRIC RATING
232nd/ 347
METRIC RANK
33.0%
IN LABOR FORCE | AGE 16-19
0.0/ 100
METRIC RATING
298th/ 347
METRIC RANK
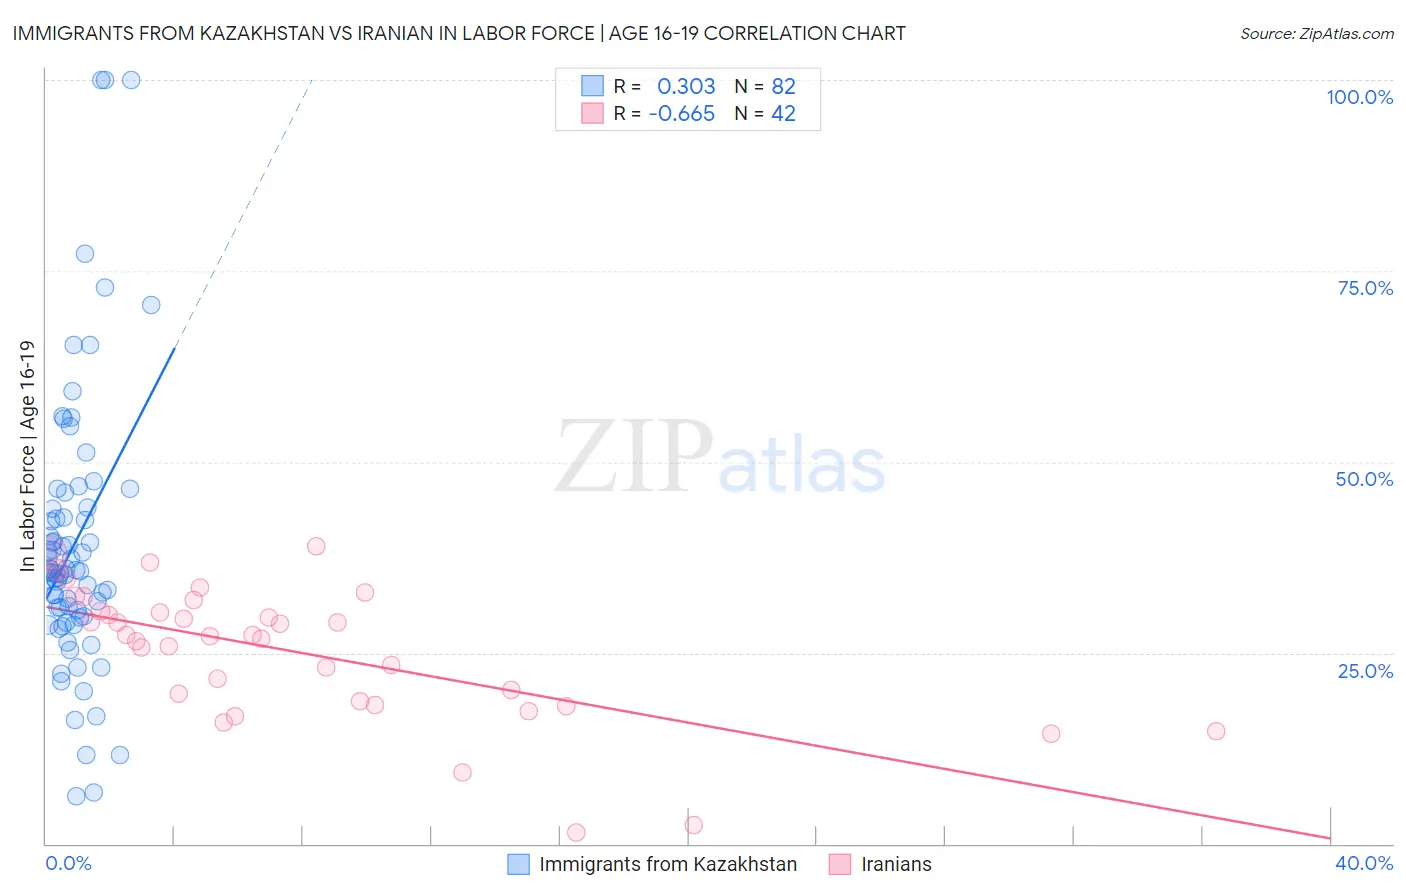
Immigrants from Kazakhstan vs Iranian In Labor Force | Age 16-19 Correlation Chart
The statistical analysis conducted on geographies consisting of 124,390,900 people shows a mild positive correlation between the proportion of Immigrants from Kazakhstan and labor force participation rate among population between the ages 16 and 19 in the United States with a correlation coefficient (R) of 0.303 and weighted average of 35.2%. Similarly, the statistical analysis conducted on geographies consisting of 316,490,712 people shows a significant negative correlation between the proportion of Iranians and labor force participation rate among population between the ages 16 and 19 in the United States with a correlation coefficient (R) of -0.665 and weighted average of 33.0%, a difference of 6.5%.
In Labor Force | Age 16-19 Correlation Summary
| Measurement | Immigrants from Kazakhstan | Iranian |
| Minimum | 6.2% | 1.4% |
| Maximum | 100.0% | 39.0% |
| Range | 93.8% | 37.6% |
| Mean | 39.1% | 25.1% |
| Median | 35.6% | 27.2% |
| Interquartile 25% (IQ1) | 29.8% | 18.6% |
| Interquartile 75% (IQ3) | 43.9% | 30.5% |
| Interquartile Range (IQR) | 14.1% | 11.9% |
| Standard Deviation (Sample) | 18.0% | 8.8% |
| Standard Deviation (Population) | 17.9% | 8.7% |
Similar Demographics by In Labor Force | Age 16-19
Demographics Similar to Immigrants from Kazakhstan by In Labor Force | Age 16-19
In terms of in labor force | age 16-19, the demographic groups most similar to Immigrants from Kazakhstan are Immigrants from Syria (35.2%, a difference of 0.0%), Immigrants from France (35.1%, a difference of 0.040%), Immigrants from Mexico (35.1%, a difference of 0.080%), Immigrants from Honduras (35.2%, a difference of 0.12%), and Immigrants from Lebanon (35.2%, a difference of 0.16%).
| Demographics | Rating | Rank | In Labor Force | Age 16-19 |
| Immigrants | Belgium | 6.1 /100 | #225 | Tragic 35.3% |
| Immigrants | Guatemala | 5.7 /100 | #226 | Tragic 35.3% |
| Mongolians | 5.7 /100 | #227 | Tragic 35.3% |
| Immigrants | Senegal | 5.5 /100 | #228 | Tragic 35.3% |
| Immigrants | Lebanon | 5.0 /100 | #229 | Tragic 35.2% |
| Immigrants | Honduras | 4.9 /100 | #230 | Tragic 35.2% |
| Immigrants | Syria | 4.5 /100 | #231 | Tragic 35.2% |
| Immigrants | Kazakhstan | 4.5 /100 | #232 | Tragic 35.2% |
| Immigrants | France | 4.3 /100 | #233 | Tragic 35.1% |
| Immigrants | Mexico | 4.2 /100 | #234 | Tragic 35.1% |
| Immigrants | Philippines | 4.0 /100 | #235 | Tragic 35.1% |
| Immigrants | Australia | 3.6 /100 | #236 | Tragic 35.1% |
| Immigrants | India | 3.5 /100 | #237 | Tragic 35.0% |
| Immigrants | Vietnam | 3.4 /100 | #238 | Tragic 35.0% |
| Inupiat | 3.2 /100 | #239 | Tragic 35.0% |
Demographics Similar to Iranians by In Labor Force | Age 16-19
In terms of in labor force | age 16-19, the demographic groups most similar to Iranians are Armenian (32.9%, a difference of 0.24%), Immigrants from Argentina (32.9%, a difference of 0.40%), Immigrants from Haiti (33.2%, a difference of 0.51%), Jamaican (33.2%, a difference of 0.60%), and Okinawan (32.8%, a difference of 0.63%).
| Demographics | Rating | Rank | In Labor Force | Age 16-19 |
| Immigrants | Belarus | 0.1 /100 | #291 | Tragic 33.4% |
| Haitians | 0.1 /100 | #292 | Tragic 33.4% |
| Immigrants | South America | 0.1 /100 | #293 | Tragic 33.3% |
| Argentineans | 0.1 /100 | #294 | Tragic 33.3% |
| Yup'ik | 0.1 /100 | #295 | Tragic 33.3% |
| Jamaicans | 0.1 /100 | #296 | Tragic 33.2% |
| Immigrants | Haiti | 0.1 /100 | #297 | Tragic 33.2% |
| Iranians | 0.0 /100 | #298 | Tragic 33.0% |
| Armenians | 0.0 /100 | #299 | Tragic 32.9% |
| Immigrants | Argentina | 0.0 /100 | #300 | Tragic 32.9% |
| Okinawans | 0.0 /100 | #301 | Tragic 32.8% |
| Belizeans | 0.0 /100 | #302 | Tragic 32.8% |
| Immigrants | Dominica | 0.0 /100 | #303 | Tragic 32.5% |
| Israelis | 0.0 /100 | #304 | Tragic 32.4% |
| Nicaraguans | 0.0 /100 | #305 | Tragic 32.4% |