Immigrants from Africa vs Iranian In Labor Force | Age 16-19
COMPARE
Immigrants from Africa
Iranian
In Labor Force | Age 16-19
In Labor Force | Age 16-19 Comparison
Immigrants from Africa
Iranians
38.0%
IN LABOR FORCE | AGE 16-19
96.1/ 100
METRIC RATING
125th/ 347
METRIC RANK
33.0%
IN LABOR FORCE | AGE 16-19
0.0/ 100
METRIC RATING
298th/ 347
METRIC RANK
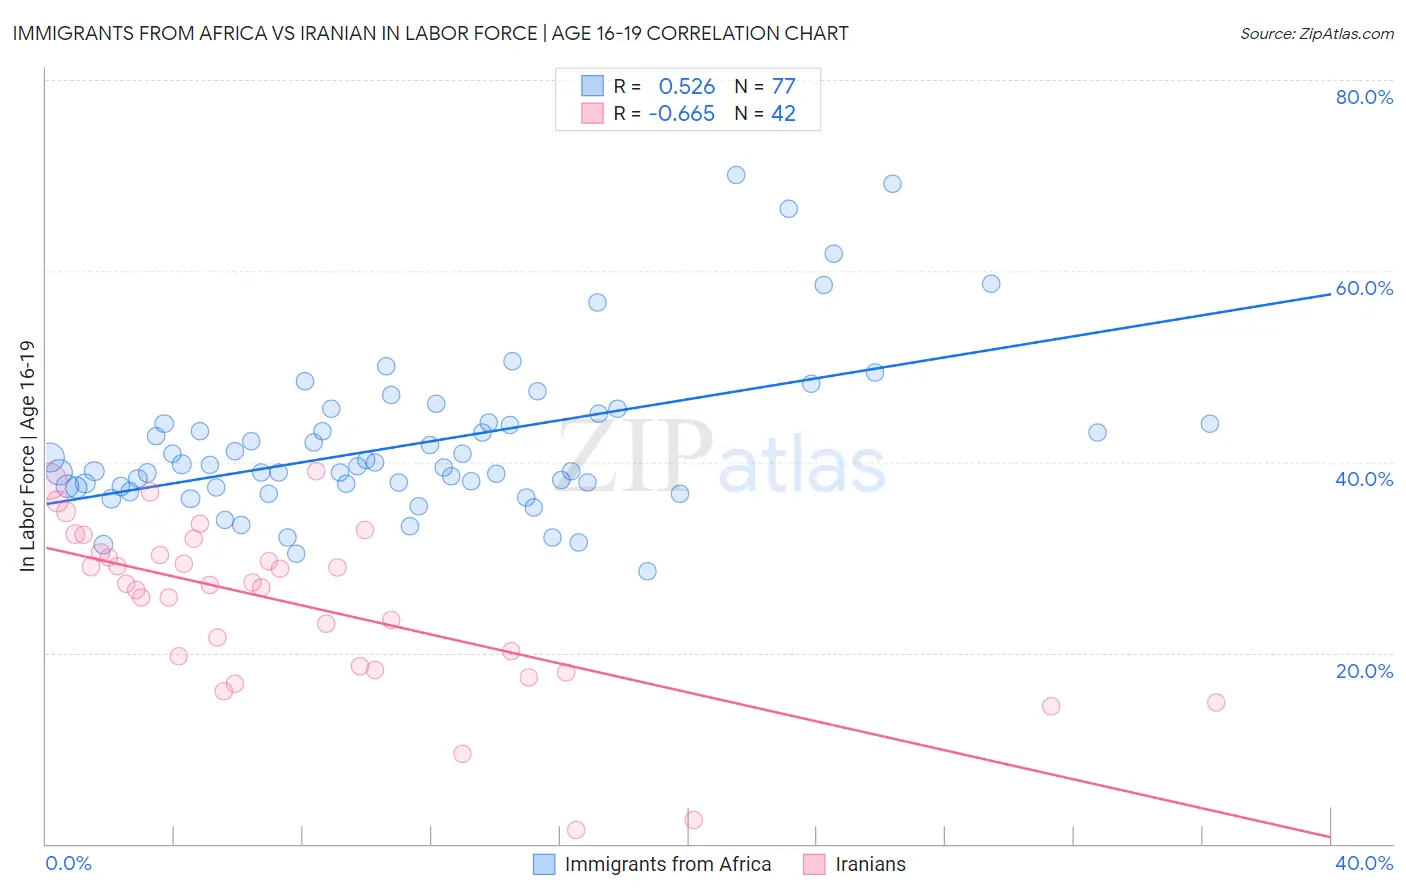
Immigrants from Africa vs Iranian In Labor Force | Age 16-19 Correlation Chart
The statistical analysis conducted on geographies consisting of 468,482,228 people shows a substantial positive correlation between the proportion of Immigrants from Africa and labor force participation rate among population between the ages 16 and 19 in the United States with a correlation coefficient (R) of 0.526 and weighted average of 38.0%. Similarly, the statistical analysis conducted on geographies consisting of 316,490,712 people shows a significant negative correlation between the proportion of Iranians and labor force participation rate among population between the ages 16 and 19 in the United States with a correlation coefficient (R) of -0.665 and weighted average of 33.0%, a difference of 15.2%.
In Labor Force | Age 16-19 Correlation Summary
| Measurement | Immigrants from Africa | Iranian |
| Minimum | 28.5% | 1.4% |
| Maximum | 70.1% | 39.0% |
| Range | 41.6% | 37.6% |
| Mean | 41.9% | 25.1% |
| Median | 39.6% | 27.2% |
| Interquartile 25% (IQ1) | 37.3% | 18.6% |
| Interquartile 75% (IQ3) | 44.1% | 30.5% |
| Interquartile Range (IQR) | 6.7% | 11.9% |
| Standard Deviation (Sample) | 8.3% | 8.8% |
| Standard Deviation (Population) | 8.3% | 8.7% |
Similar Demographics by In Labor Force | Age 16-19
Demographics Similar to Immigrants from Africa by In Labor Force | Age 16-19
In terms of in labor force | age 16-19, the demographic groups most similar to Immigrants from Africa are Immigrants from England (38.1%, a difference of 0.10%), African (38.0%, a difference of 0.16%), Choctaw (38.0%, a difference of 0.16%), New Zealander (38.0%, a difference of 0.17%), and Seminole (38.1%, a difference of 0.19%).
| Demographics | Rating | Rank | In Labor Force | Age 16-19 |
| Immigrants | Nepal | 97.8 /100 | #118 | Exceptional 38.3% |
| Assyrians/Chaldeans/Syriacs | 97.8 /100 | #119 | Exceptional 38.3% |
| Ukrainians | 97.6 /100 | #120 | Exceptional 38.3% |
| Ethiopians | 97.4 /100 | #121 | Exceptional 38.2% |
| Guamanians/Chamorros | 97.4 /100 | #122 | Exceptional 38.2% |
| Seminole | 96.7 /100 | #123 | Exceptional 38.1% |
| Immigrants | England | 96.4 /100 | #124 | Exceptional 38.1% |
| Immigrants | Africa | 96.1 /100 | #125 | Exceptional 38.0% |
| Africans | 95.6 /100 | #126 | Exceptional 38.0% |
| Choctaw | 95.6 /100 | #127 | Exceptional 38.0% |
| New Zealanders | 95.6 /100 | #128 | Exceptional 38.0% |
| Spaniards | 95.5 /100 | #129 | Exceptional 38.0% |
| Immigrants | Zimbabwe | 95.4 /100 | #130 | Exceptional 38.0% |
| Immigrants | Austria | 95.0 /100 | #131 | Exceptional 37.9% |
| Immigrants | Oceania | 94.7 /100 | #132 | Exceptional 37.9% |
Demographics Similar to Iranians by In Labor Force | Age 16-19
In terms of in labor force | age 16-19, the demographic groups most similar to Iranians are Armenian (32.9%, a difference of 0.24%), Immigrants from Argentina (32.9%, a difference of 0.40%), Immigrants from Haiti (33.2%, a difference of 0.51%), Jamaican (33.2%, a difference of 0.60%), and Okinawan (32.8%, a difference of 0.63%).
| Demographics | Rating | Rank | In Labor Force | Age 16-19 |
| Immigrants | Belarus | 0.1 /100 | #291 | Tragic 33.4% |
| Haitians | 0.1 /100 | #292 | Tragic 33.4% |
| Immigrants | South America | 0.1 /100 | #293 | Tragic 33.3% |
| Argentineans | 0.1 /100 | #294 | Tragic 33.3% |
| Yup'ik | 0.1 /100 | #295 | Tragic 33.3% |
| Jamaicans | 0.1 /100 | #296 | Tragic 33.2% |
| Immigrants | Haiti | 0.1 /100 | #297 | Tragic 33.2% |
| Iranians | 0.0 /100 | #298 | Tragic 33.0% |
| Armenians | 0.0 /100 | #299 | Tragic 32.9% |
| Immigrants | Argentina | 0.0 /100 | #300 | Tragic 32.9% |
| Okinawans | 0.0 /100 | #301 | Tragic 32.8% |
| Belizeans | 0.0 /100 | #302 | Tragic 32.8% |
| Immigrants | Dominica | 0.0 /100 | #303 | Tragic 32.5% |
| Israelis | 0.0 /100 | #304 | Tragic 32.4% |
| Nicaraguans | 0.0 /100 | #305 | Tragic 32.4% |