Black/African American vs Immigrants from Northern Africa In Labor Force | Age 45-54
COMPARE
Black/African American
Immigrants from Northern Africa
In Labor Force | Age 45-54
In Labor Force | Age 45-54 Comparison
Blacks/African Americans
Immigrants from Northern Africa
79.3%
IN LABOR FORCE | AGE 45-54
0.0/ 100
METRIC RATING
315th/ 347
METRIC RANK
83.3%
IN LABOR FORCE | AGE 45-54
95.7/ 100
METRIC RATING
86th/ 347
METRIC RANK
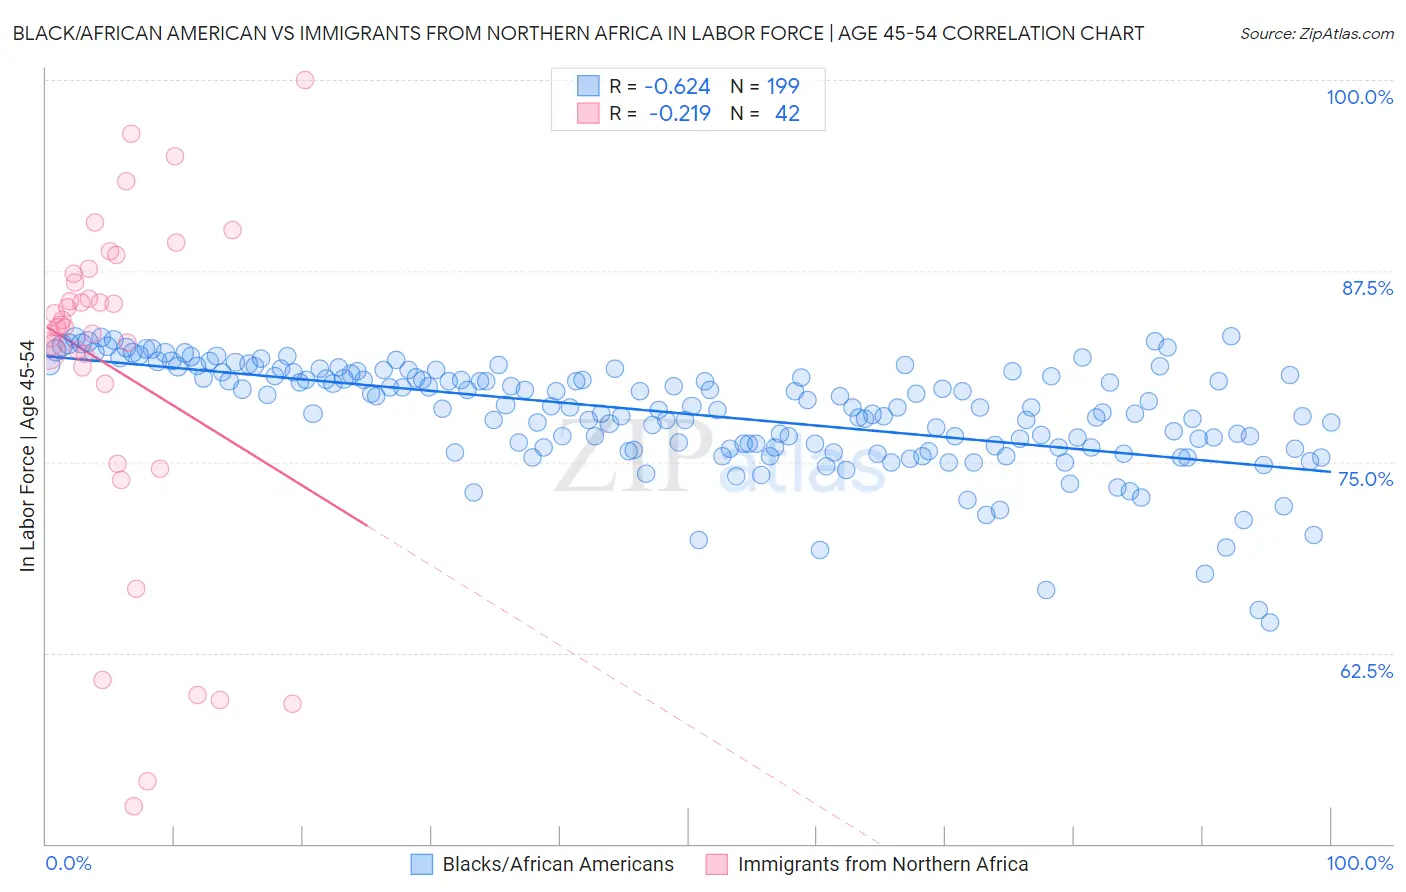
Black/African American vs Immigrants from Northern Africa In Labor Force | Age 45-54 Correlation Chart
The statistical analysis conducted on geographies consisting of 565,123,910 people shows a significant negative correlation between the proportion of Blacks/African Americans and labor force participation rate among population between the ages 45 and 54 in the United States with a correlation coefficient (R) of -0.624 and weighted average of 79.3%. Similarly, the statistical analysis conducted on geographies consisting of 321,062,040 people shows a weak negative correlation between the proportion of Immigrants from Northern Africa and labor force participation rate among population between the ages 45 and 54 in the United States with a correlation coefficient (R) of -0.219 and weighted average of 83.3%, a difference of 5.0%.
In Labor Force | Age 45-54 Correlation Summary
| Measurement | Black/African American | Immigrants from Northern Africa |
| Minimum | 64.5% | 52.4% |
| Maximum | 83.2% | 100.0% |
| Range | 18.7% | 47.6% |
| Mean | 78.1% | 81.0% |
| Median | 78.6% | 83.9% |
| Interquartile 25% (IQ1) | 75.9% | 80.1% |
| Interquartile 75% (IQ3) | 80.8% | 87.3% |
| Interquartile Range (IQR) | 4.9% | 7.2% |
| Standard Deviation (Sample) | 3.5% | 11.4% |
| Standard Deviation (Population) | 3.5% | 11.2% |
Similar Demographics by In Labor Force | Age 45-54
Demographics Similar to Blacks/African Americans by In Labor Force | Age 45-54
In terms of in labor force | age 45-54, the demographic groups most similar to Blacks/African Americans are Shoshone (79.3%, a difference of 0.080%), Ottawa (79.5%, a difference of 0.14%), Colville (79.5%, a difference of 0.17%), Comanche (79.2%, a difference of 0.22%), and Chickasaw (79.0%, a difference of 0.39%).
| Demographics | Rating | Rank | In Labor Force | Age 45-54 |
| Central American Indians | 0.0 /100 | #308 | Tragic 80.0% |
| Potawatomi | 0.0 /100 | #309 | Tragic 80.0% |
| Inupiat | 0.0 /100 | #310 | Tragic 79.9% |
| Mexicans | 0.0 /100 | #311 | Tragic 79.8% |
| Immigrants | Mexico | 0.0 /100 | #312 | Tragic 79.7% |
| Colville | 0.0 /100 | #313 | Tragic 79.5% |
| Ottawa | 0.0 /100 | #314 | Tragic 79.5% |
| Blacks/African Americans | 0.0 /100 | #315 | Tragic 79.3% |
| Shoshone | 0.0 /100 | #316 | Tragic 79.3% |
| Comanche | 0.0 /100 | #317 | Tragic 79.2% |
| Chickasaw | 0.0 /100 | #318 | Tragic 79.0% |
| Cherokee | 0.0 /100 | #319 | Tragic 79.0% |
| Yaqui | 0.0 /100 | #320 | Tragic 78.9% |
| Yup'ik | 0.0 /100 | #321 | Tragic 78.6% |
| Crow | 0.0 /100 | #322 | Tragic 78.3% |
Demographics Similar to Immigrants from Northern Africa by In Labor Force | Age 45-54
In terms of in labor force | age 45-54, the demographic groups most similar to Immigrants from Northern Africa are Immigrants from Eastern Europe (83.3%, a difference of 0.0%), Greek (83.3%, a difference of 0.010%), Immigrants from Asia (83.3%, a difference of 0.010%), Indian (Asian) (83.3%, a difference of 0.010%), and Immigrants from Japan (83.3%, a difference of 0.010%).
| Demographics | Rating | Rank | In Labor Force | Age 45-54 |
| Belgians | 96.5 /100 | #79 | Exceptional 83.4% |
| Immigrants | Croatia | 96.5 /100 | #80 | Exceptional 83.4% |
| Jordanians | 96.4 /100 | #81 | Exceptional 83.4% |
| Immigrants | Eastern Asia | 96.3 /100 | #82 | Exceptional 83.4% |
| Immigrants | Zimbabwe | 96.3 /100 | #83 | Exceptional 83.4% |
| Immigrants | Bosnia and Herzegovina | 96.0 /100 | #84 | Exceptional 83.3% |
| Greeks | 95.9 /100 | #85 | Exceptional 83.3% |
| Immigrants | Northern Africa | 95.7 /100 | #86 | Exceptional 83.3% |
| Immigrants | Eastern Europe | 95.6 /100 | #87 | Exceptional 83.3% |
| Immigrants | Asia | 95.6 /100 | #88 | Exceptional 83.3% |
| Indians (Asian) | 95.5 /100 | #89 | Exceptional 83.3% |
| Immigrants | Japan | 95.5 /100 | #90 | Exceptional 83.3% |
| South Americans | 95.5 /100 | #91 | Exceptional 83.3% |
| Danes | 95.3 /100 | #92 | Exceptional 83.3% |
| Italians | 95.1 /100 | #93 | Exceptional 83.3% |