Black/African American vs Immigrants from Kenya In Labor Force | Age 45-54
COMPARE
Black/African American
Immigrants from Kenya
In Labor Force | Age 45-54
In Labor Force | Age 45-54 Comparison
Blacks/African Americans
Immigrants from Kenya
79.3%
IN LABOR FORCE | AGE 45-54
0.0/ 100
METRIC RATING
315th/ 347
METRIC RANK
83.5%
IN LABOR FORCE | AGE 45-54
97.9/ 100
METRIC RATING
64th/ 347
METRIC RANK
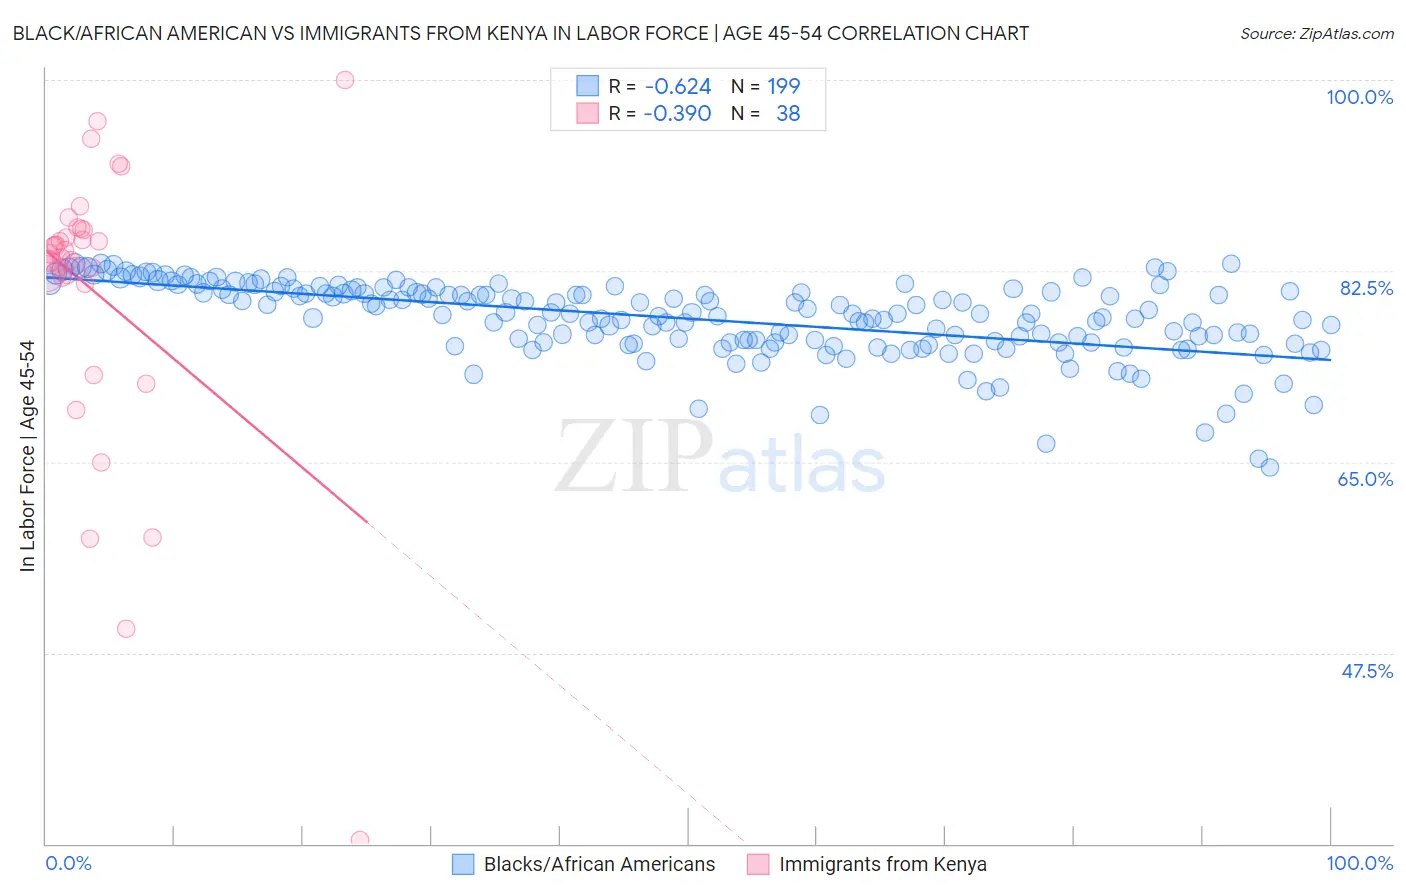
Black/African American vs Immigrants from Kenya In Labor Force | Age 45-54 Correlation Chart
The statistical analysis conducted on geographies consisting of 565,123,910 people shows a significant negative correlation between the proportion of Blacks/African Americans and labor force participation rate among population between the ages 45 and 54 in the United States with a correlation coefficient (R) of -0.624 and weighted average of 79.3%. Similarly, the statistical analysis conducted on geographies consisting of 217,994,383 people shows a mild negative correlation between the proportion of Immigrants from Kenya and labor force participation rate among population between the ages 45 and 54 in the United States with a correlation coefficient (R) of -0.390 and weighted average of 83.5%, a difference of 5.2%.
In Labor Force | Age 45-54 Correlation Summary
| Measurement | Black/African American | Immigrants from Kenya |
| Minimum | 64.5% | 30.4% |
| Maximum | 83.2% | 100.0% |
| Range | 18.7% | 69.6% |
| Mean | 78.1% | 80.5% |
| Median | 78.6% | 83.9% |
| Interquartile 25% (IQ1) | 75.9% | 81.9% |
| Interquartile 75% (IQ3) | 80.8% | 86.3% |
| Interquartile Range (IQR) | 4.9% | 4.4% |
| Standard Deviation (Sample) | 3.5% | 13.3% |
| Standard Deviation (Population) | 3.5% | 13.1% |
Similar Demographics by In Labor Force | Age 45-54
Demographics Similar to Blacks/African Americans by In Labor Force | Age 45-54
In terms of in labor force | age 45-54, the demographic groups most similar to Blacks/African Americans are Shoshone (79.3%, a difference of 0.080%), Ottawa (79.5%, a difference of 0.14%), Colville (79.5%, a difference of 0.17%), Comanche (79.2%, a difference of 0.22%), and Chickasaw (79.0%, a difference of 0.39%).
| Demographics | Rating | Rank | In Labor Force | Age 45-54 |
| Central American Indians | 0.0 /100 | #308 | Tragic 80.0% |
| Potawatomi | 0.0 /100 | #309 | Tragic 80.0% |
| Inupiat | 0.0 /100 | #310 | Tragic 79.9% |
| Mexicans | 0.0 /100 | #311 | Tragic 79.8% |
| Immigrants | Mexico | 0.0 /100 | #312 | Tragic 79.7% |
| Colville | 0.0 /100 | #313 | Tragic 79.5% |
| Ottawa | 0.0 /100 | #314 | Tragic 79.5% |
| Blacks/African Americans | 0.0 /100 | #315 | Tragic 79.3% |
| Shoshone | 0.0 /100 | #316 | Tragic 79.3% |
| Comanche | 0.0 /100 | #317 | Tragic 79.2% |
| Chickasaw | 0.0 /100 | #318 | Tragic 79.0% |
| Cherokee | 0.0 /100 | #319 | Tragic 79.0% |
| Yaqui | 0.0 /100 | #320 | Tragic 78.9% |
| Yup'ik | 0.0 /100 | #321 | Tragic 78.6% |
| Crow | 0.0 /100 | #322 | Tragic 78.3% |
Demographics Similar to Immigrants from Kenya by In Labor Force | Age 45-54
In terms of in labor force | age 45-54, the demographic groups most similar to Immigrants from Kenya are Afghan (83.5%, a difference of 0.0%), Egyptian (83.5%, a difference of 0.0%), Immigrants from Taiwan (83.5%, a difference of 0.010%), Asian (83.4%, a difference of 0.020%), and Chilean (83.4%, a difference of 0.020%).
| Demographics | Rating | Rank | In Labor Force | Age 45-54 |
| Paraguayans | 98.5 /100 | #57 | Exceptional 83.5% |
| Eastern Europeans | 98.5 /100 | #58 | Exceptional 83.5% |
| Bhutanese | 98.3 /100 | #59 | Exceptional 83.5% |
| Carpatho Rusyns | 98.3 /100 | #60 | Exceptional 83.5% |
| Filipinos | 98.3 /100 | #61 | Exceptional 83.5% |
| Immigrants | Taiwan | 98.0 /100 | #62 | Exceptional 83.5% |
| Afghans | 97.9 /100 | #63 | Exceptional 83.5% |
| Immigrants | Kenya | 97.9 /100 | #64 | Exceptional 83.5% |
| Egyptians | 97.9 /100 | #65 | Exceptional 83.5% |
| Asians | 97.7 /100 | #66 | Exceptional 83.4% |
| Chileans | 97.7 /100 | #67 | Exceptional 83.4% |
| Immigrants | Colombia | 97.6 /100 | #68 | Exceptional 83.4% |
| Taiwanese | 97.5 /100 | #69 | Exceptional 83.4% |
| Immigrants | Latvia | 97.4 /100 | #70 | Exceptional 83.4% |
| Colombians | 97.3 /100 | #71 | Exceptional 83.4% |