Black/African American vs Bulgarian In Labor Force | Age 45-54
COMPARE
Black/African American
Bulgarian
In Labor Force | Age 45-54
In Labor Force | Age 45-54 Comparison
Blacks/African Americans
Bulgarians
79.3%
IN LABOR FORCE | AGE 45-54
0.0/ 100
METRIC RATING
315th/ 347
METRIC RANK
84.2%
IN LABOR FORCE | AGE 45-54
100.0/ 100
METRIC RATING
12th/ 347
METRIC RANK
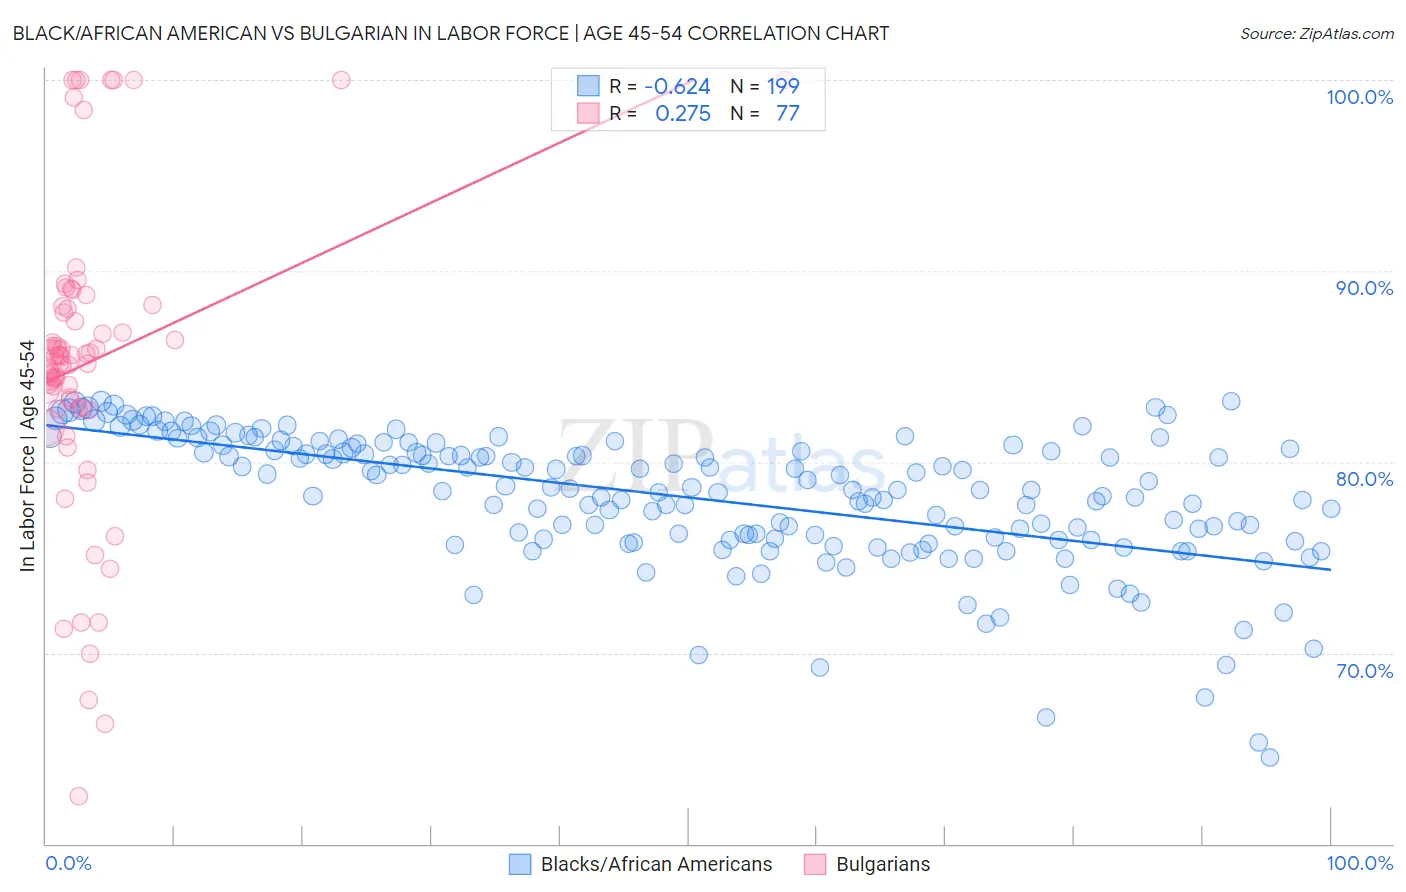
Black/African American vs Bulgarian In Labor Force | Age 45-54 Correlation Chart
The statistical analysis conducted on geographies consisting of 565,123,910 people shows a significant negative correlation between the proportion of Blacks/African Americans and labor force participation rate among population between the ages 45 and 54 in the United States with a correlation coefficient (R) of -0.624 and weighted average of 79.3%. Similarly, the statistical analysis conducted on geographies consisting of 205,560,159 people shows a weak positive correlation between the proportion of Bulgarians and labor force participation rate among population between the ages 45 and 54 in the United States with a correlation coefficient (R) of 0.275 and weighted average of 84.2%, a difference of 6.2%.
In Labor Force | Age 45-54 Correlation Summary
| Measurement | Black/African American | Bulgarian |
| Minimum | 64.5% | 62.5% |
| Maximum | 83.2% | 100.0% |
| Range | 18.7% | 37.5% |
| Mean | 78.1% | 85.2% |
| Median | 78.6% | 85.5% |
| Interquartile 25% (IQ1) | 75.9% | 82.8% |
| Interquartile 75% (IQ3) | 80.8% | 88.1% |
| Interquartile Range (IQR) | 4.9% | 5.2% |
| Standard Deviation (Sample) | 3.5% | 7.9% |
| Standard Deviation (Population) | 3.5% | 7.9% |
Similar Demographics by In Labor Force | Age 45-54
Demographics Similar to Blacks/African Americans by In Labor Force | Age 45-54
In terms of in labor force | age 45-54, the demographic groups most similar to Blacks/African Americans are Shoshone (79.3%, a difference of 0.080%), Ottawa (79.5%, a difference of 0.14%), Colville (79.5%, a difference of 0.17%), Comanche (79.2%, a difference of 0.22%), and Chickasaw (79.0%, a difference of 0.39%).
| Demographics | Rating | Rank | In Labor Force | Age 45-54 |
| Central American Indians | 0.0 /100 | #308 | Tragic 80.0% |
| Potawatomi | 0.0 /100 | #309 | Tragic 80.0% |
| Inupiat | 0.0 /100 | #310 | Tragic 79.9% |
| Mexicans | 0.0 /100 | #311 | Tragic 79.8% |
| Immigrants | Mexico | 0.0 /100 | #312 | Tragic 79.7% |
| Colville | 0.0 /100 | #313 | Tragic 79.5% |
| Ottawa | 0.0 /100 | #314 | Tragic 79.5% |
| Blacks/African Americans | 0.0 /100 | #315 | Tragic 79.3% |
| Shoshone | 0.0 /100 | #316 | Tragic 79.3% |
| Comanche | 0.0 /100 | #317 | Tragic 79.2% |
| Chickasaw | 0.0 /100 | #318 | Tragic 79.0% |
| Cherokee | 0.0 /100 | #319 | Tragic 79.0% |
| Yaqui | 0.0 /100 | #320 | Tragic 78.9% |
| Yup'ik | 0.0 /100 | #321 | Tragic 78.6% |
| Crow | 0.0 /100 | #322 | Tragic 78.3% |
Demographics Similar to Bulgarians by In Labor Force | Age 45-54
In terms of in labor force | age 45-54, the demographic groups most similar to Bulgarians are Thai (84.3%, a difference of 0.11%), Chinese (84.1%, a difference of 0.11%), Cambodian (84.1%, a difference of 0.14%), Norwegian (84.4%, a difference of 0.20%), and Cypriot (84.1%, a difference of 0.20%).
| Demographics | Rating | Rank | In Labor Force | Age 45-54 |
| Ethiopians | 100.0 /100 | #5 | Exceptional 84.8% |
| Immigrants | India | 100.0 /100 | #6 | Exceptional 84.7% |
| Immigrants | Cameroon | 100.0 /100 | #7 | Exceptional 84.6% |
| Sierra Leoneans | 100.0 /100 | #8 | Exceptional 84.5% |
| Immigrants | Sierra Leone | 100.0 /100 | #9 | Exceptional 84.4% |
| Norwegians | 100.0 /100 | #10 | Exceptional 84.4% |
| Thais | 100.0 /100 | #11 | Exceptional 84.3% |
| Bulgarians | 100.0 /100 | #12 | Exceptional 84.2% |
| Chinese | 99.9 /100 | #13 | Exceptional 84.1% |
| Cambodians | 99.9 /100 | #14 | Exceptional 84.1% |
| Cypriots | 99.9 /100 | #15 | Exceptional 84.1% |
| Immigrants | Nepal | 99.9 /100 | #16 | Exceptional 84.0% |
| Zimbabweans | 99.9 /100 | #17 | Exceptional 84.0% |
| Immigrants | South Central Asia | 99.9 /100 | #18 | Exceptional 84.0% |
| Czechs | 99.8 /100 | #19 | Exceptional 83.9% |