Immigrants from Russia vs Bahamian In Labor Force | Age 45-54
COMPARE
Immigrants from Russia
Bahamian
In Labor Force | Age 45-54
In Labor Force | Age 45-54 Comparison
Immigrants from Russia
Bahamians
83.2%
IN LABOR FORCE | AGE 45-54
90.1/ 100
METRIC RATING
120th/ 347
METRIC RANK
82.2%
IN LABOR FORCE | AGE 45-54
3.6/ 100
METRIC RATING
220th/ 347
METRIC RANK
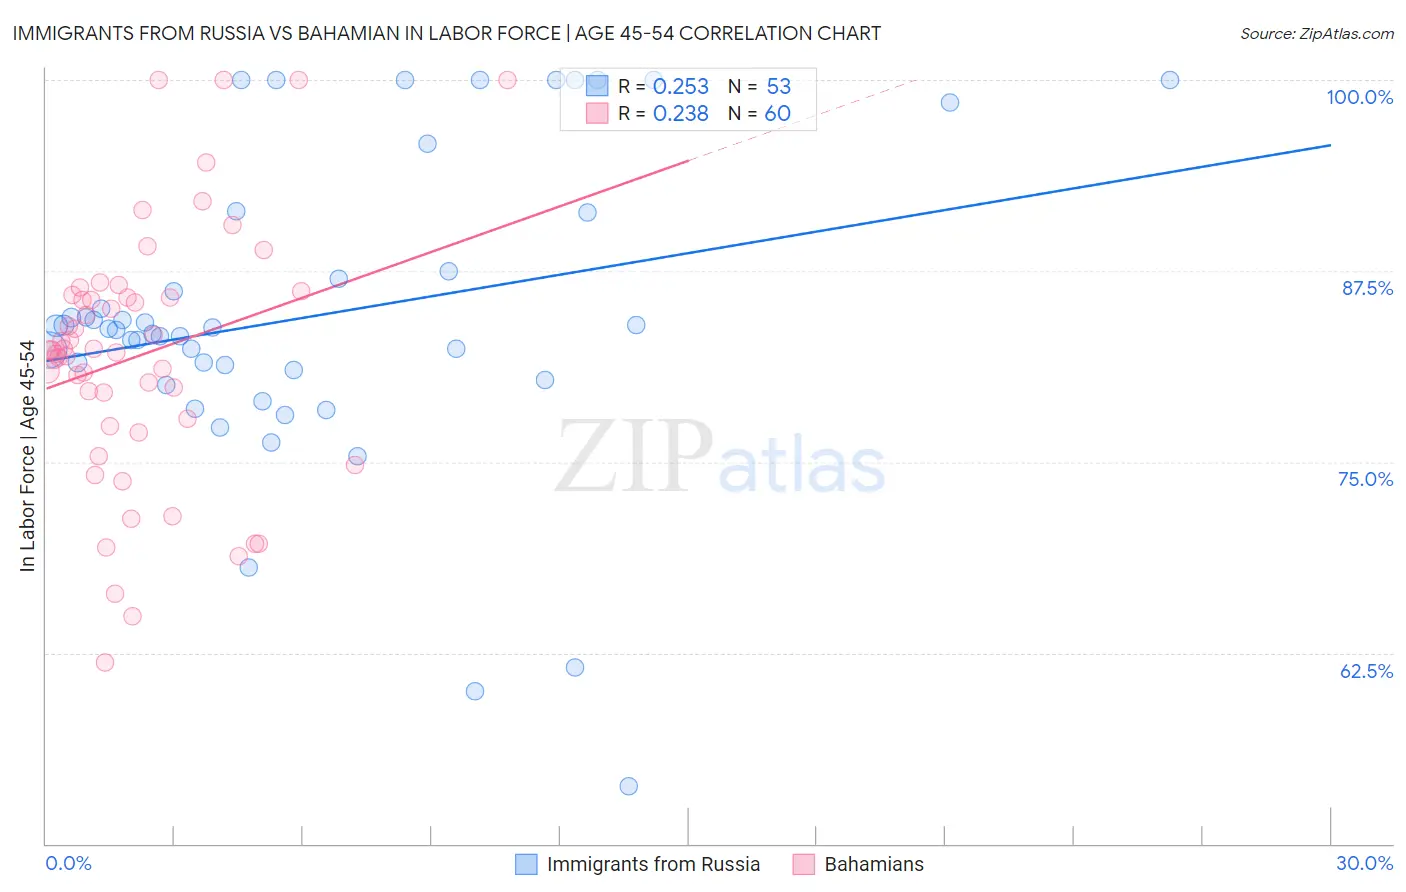
Immigrants from Russia vs Bahamian In Labor Force | Age 45-54 Correlation Chart
The statistical analysis conducted on geographies consisting of 347,716,687 people shows a weak positive correlation between the proportion of Immigrants from Russia and labor force participation rate among population between the ages 45 and 54 in the United States with a correlation coefficient (R) of 0.253 and weighted average of 83.2%. Similarly, the statistical analysis conducted on geographies consisting of 112,617,260 people shows a weak positive correlation between the proportion of Bahamians and labor force participation rate among population between the ages 45 and 54 in the United States with a correlation coefficient (R) of 0.238 and weighted average of 82.2%, a difference of 1.2%.
In Labor Force | Age 45-54 Correlation Summary
| Measurement | Immigrants from Russia | Bahamian |
| Minimum | 53.8% | 61.9% |
| Maximum | 100.0% | 100.0% |
| Range | 46.2% | 38.1% |
| Mean | 84.6% | 82.0% |
| Median | 83.7% | 82.3% |
| Interquartile 25% (IQ1) | 80.7% | 77.6% |
| Interquartile 75% (IQ3) | 89.4% | 85.9% |
| Interquartile Range (IQR) | 8.7% | 8.3% |
| Standard Deviation (Sample) | 10.2% | 8.4% |
| Standard Deviation (Population) | 10.1% | 8.3% |
Similar Demographics by In Labor Force | Age 45-54
Demographics Similar to Immigrants from Russia by In Labor Force | Age 45-54
In terms of in labor force | age 45-54, the demographic groups most similar to Immigrants from Russia are Immigrants from Uruguay (83.2%, a difference of 0.0%), Immigrants from Europe (83.2%, a difference of 0.010%), Immigrants from China (83.2%, a difference of 0.020%), Uruguayan (83.1%, a difference of 0.020%), and Immigrants from Vietnam (83.1%, a difference of 0.030%).
| Demographics | Rating | Rank | In Labor Force | Age 45-54 |
| Immigrants | Albania | 91.8 /100 | #113 | Exceptional 83.2% |
| Assyrians/Chaldeans/Syriacs | 91.7 /100 | #114 | Exceptional 83.2% |
| Immigrants | Chile | 91.6 /100 | #115 | Exceptional 83.2% |
| Immigrants | Malaysia | 91.4 /100 | #116 | Exceptional 83.2% |
| Immigrants | China | 90.9 /100 | #117 | Exceptional 83.2% |
| Immigrants | Europe | 90.7 /100 | #118 | Exceptional 83.2% |
| Immigrants | Uruguay | 90.2 /100 | #119 | Exceptional 83.2% |
| Immigrants | Russia | 90.1 /100 | #120 | Exceptional 83.2% |
| Uruguayans | 89.4 /100 | #121 | Excellent 83.1% |
| Immigrants | Vietnam | 88.9 /100 | #122 | Excellent 83.1% |
| Tongans | 88.2 /100 | #123 | Excellent 83.1% |
| Bermudans | 88.0 /100 | #124 | Excellent 83.1% |
| Immigrants | Iran | 87.2 /100 | #125 | Excellent 83.1% |
| Immigrants | Belgium | 86.4 /100 | #126 | Excellent 83.1% |
| Immigrants | Jordan | 85.2 /100 | #127 | Excellent 83.1% |
Demographics Similar to Bahamians by In Labor Force | Age 45-54
In terms of in labor force | age 45-54, the demographic groups most similar to Bahamians are Panamanian (82.2%, a difference of 0.010%), Immigrants from Ecuador (82.2%, a difference of 0.010%), French (82.2%, a difference of 0.030%), Immigrants (82.1%, a difference of 0.030%), and English (82.2%, a difference of 0.050%).
| Demographics | Rating | Rank | In Labor Force | Age 45-54 |
| Immigrants | Uzbekistan | 5.8 /100 | #213 | Tragic 82.3% |
| Immigrants | Panama | 5.6 /100 | #214 | Tragic 82.2% |
| Iraqis | 5.6 /100 | #215 | Tragic 82.2% |
| Scottish | 5.3 /100 | #216 | Tragic 82.2% |
| Portuguese | 4.7 /100 | #217 | Tragic 82.2% |
| English | 4.4 /100 | #218 | Tragic 82.2% |
| French | 4.1 /100 | #219 | Tragic 82.2% |
| Bahamians | 3.6 /100 | #220 | Tragic 82.2% |
| Panamanians | 3.5 /100 | #221 | Tragic 82.2% |
| Immigrants | Ecuador | 3.4 /100 | #222 | Tragic 82.2% |
| Immigrants | Immigrants | 3.1 /100 | #223 | Tragic 82.1% |
| Immigrants | Jamaica | 2.7 /100 | #224 | Tragic 82.1% |
| Immigrants | Oceania | 2.5 /100 | #225 | Tragic 82.1% |
| Immigrants | Caribbean | 2.5 /100 | #226 | Tragic 82.1% |
| Immigrants | Germany | 2.4 /100 | #227 | Tragic 82.1% |