Black/African American vs Burmese In Labor Force | Age 45-54
COMPARE
Black/African American
Burmese
In Labor Force | Age 45-54
In Labor Force | Age 45-54 Comparison
Blacks/African Americans
Burmese
79.3%
IN LABOR FORCE | AGE 45-54
0.0/ 100
METRIC RATING
315th/ 347
METRIC RANK
83.6%
IN LABOR FORCE | AGE 45-54
99.1/ 100
METRIC RATING
44th/ 347
METRIC RANK
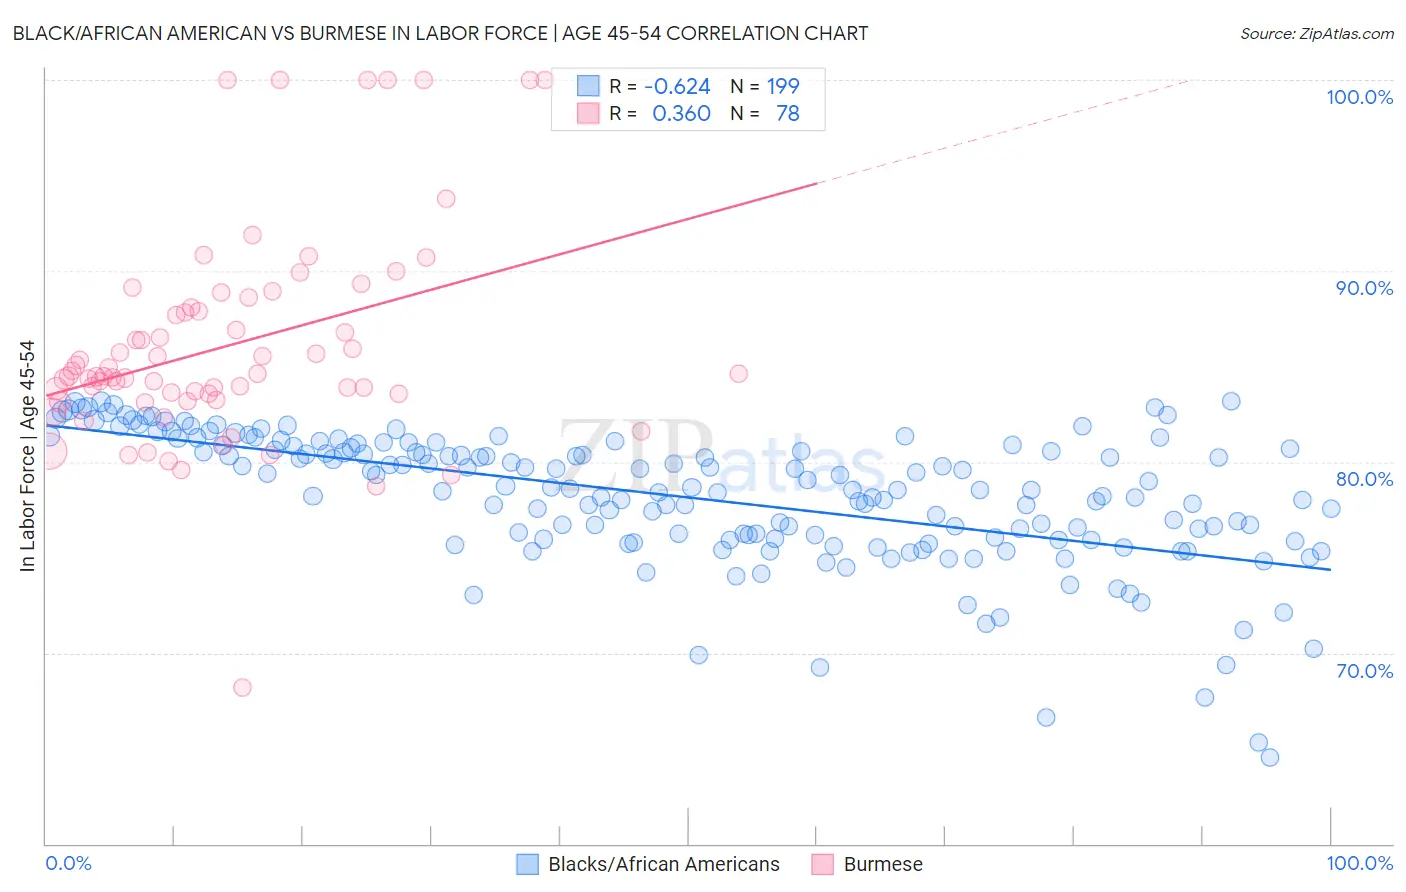
Black/African American vs Burmese In Labor Force | Age 45-54 Correlation Chart
The statistical analysis conducted on geographies consisting of 565,123,910 people shows a significant negative correlation between the proportion of Blacks/African Americans and labor force participation rate among population between the ages 45 and 54 in the United States with a correlation coefficient (R) of -0.624 and weighted average of 79.3%. Similarly, the statistical analysis conducted on geographies consisting of 464,867,064 people shows a mild positive correlation between the proportion of Burmese and labor force participation rate among population between the ages 45 and 54 in the United States with a correlation coefficient (R) of 0.360 and weighted average of 83.6%, a difference of 5.4%.
In Labor Force | Age 45-54 Correlation Summary
| Measurement | Black/African American | Burmese |
| Minimum | 64.5% | 68.2% |
| Maximum | 83.2% | 100.0% |
| Range | 18.7% | 31.8% |
| Mean | 78.1% | 86.1% |
| Median | 78.6% | 84.5% |
| Interquartile 25% (IQ1) | 75.9% | 83.6% |
| Interquartile 75% (IQ3) | 80.8% | 88.1% |
| Interquartile Range (IQR) | 4.9% | 4.5% |
| Standard Deviation (Sample) | 3.5% | 5.7% |
| Standard Deviation (Population) | 3.5% | 5.6% |
Similar Demographics by In Labor Force | Age 45-54
Demographics Similar to Blacks/African Americans by In Labor Force | Age 45-54
In terms of in labor force | age 45-54, the demographic groups most similar to Blacks/African Americans are Shoshone (79.3%, a difference of 0.080%), Ottawa (79.5%, a difference of 0.14%), Colville (79.5%, a difference of 0.17%), Comanche (79.2%, a difference of 0.22%), and Chickasaw (79.0%, a difference of 0.39%).
| Demographics | Rating | Rank | In Labor Force | Age 45-54 |
| Central American Indians | 0.0 /100 | #308 | Tragic 80.0% |
| Potawatomi | 0.0 /100 | #309 | Tragic 80.0% |
| Inupiat | 0.0 /100 | #310 | Tragic 79.9% |
| Mexicans | 0.0 /100 | #311 | Tragic 79.8% |
| Immigrants | Mexico | 0.0 /100 | #312 | Tragic 79.7% |
| Colville | 0.0 /100 | #313 | Tragic 79.5% |
| Ottawa | 0.0 /100 | #314 | Tragic 79.5% |
| Blacks/African Americans | 0.0 /100 | #315 | Tragic 79.3% |
| Shoshone | 0.0 /100 | #316 | Tragic 79.3% |
| Comanche | 0.0 /100 | #317 | Tragic 79.2% |
| Chickasaw | 0.0 /100 | #318 | Tragic 79.0% |
| Cherokee | 0.0 /100 | #319 | Tragic 79.0% |
| Yaqui | 0.0 /100 | #320 | Tragic 78.9% |
| Yup'ik | 0.0 /100 | #321 | Tragic 78.6% |
| Crow | 0.0 /100 | #322 | Tragic 78.3% |
Demographics Similar to Burmese by In Labor Force | Age 45-54
In terms of in labor force | age 45-54, the demographic groups most similar to Burmese are Immigrants from Hong Kong (83.6%, a difference of 0.0%), Lithuanian (83.6%, a difference of 0.010%), Venezuelan (83.6%, a difference of 0.020%), Croatian (83.6%, a difference of 0.030%), and Immigrants from Poland (83.6%, a difference of 0.030%).
| Demographics | Rating | Rank | In Labor Force | Age 45-54 |
| Swedes | 99.4 /100 | #37 | Exceptional 83.7% |
| Immigrants | Venezuela | 99.4 /100 | #38 | Exceptional 83.7% |
| Immigrants | Cuba | 99.4 /100 | #39 | Exceptional 83.7% |
| Immigrants | Uganda | 99.4 /100 | #40 | Exceptional 83.7% |
| Immigrants | Korea | 99.3 /100 | #41 | Exceptional 83.7% |
| Immigrants | Moldova | 99.3 /100 | #42 | Exceptional 83.7% |
| Venezuelans | 99.2 /100 | #43 | Exceptional 83.6% |
| Burmese | 99.1 /100 | #44 | Exceptional 83.6% |
| Immigrants | Hong Kong | 99.1 /100 | #45 | Exceptional 83.6% |
| Lithuanians | 99.1 /100 | #46 | Exceptional 83.6% |
| Croatians | 99.0 /100 | #47 | Exceptional 83.6% |
| Immigrants | Poland | 99.0 /100 | #48 | Exceptional 83.6% |
| Immigrants | Morocco | 99.0 /100 | #49 | Exceptional 83.6% |
| Immigrants | Greece | 98.8 /100 | #50 | Exceptional 83.6% |
| Immigrants | Turkey | 98.8 /100 | #51 | Exceptional 83.6% |