Immigrants from Singapore vs Bahamian In Labor Force | Age 45-54
COMPARE
Immigrants from Singapore
Bahamian
In Labor Force | Age 45-54
In Labor Force | Age 45-54 Comparison
Immigrants from Singapore
Bahamians
83.3%
IN LABOR FORCE | AGE 45-54
93.9/ 100
METRIC RATING
102nd/ 347
METRIC RANK
82.2%
IN LABOR FORCE | AGE 45-54
3.6/ 100
METRIC RATING
220th/ 347
METRIC RANK
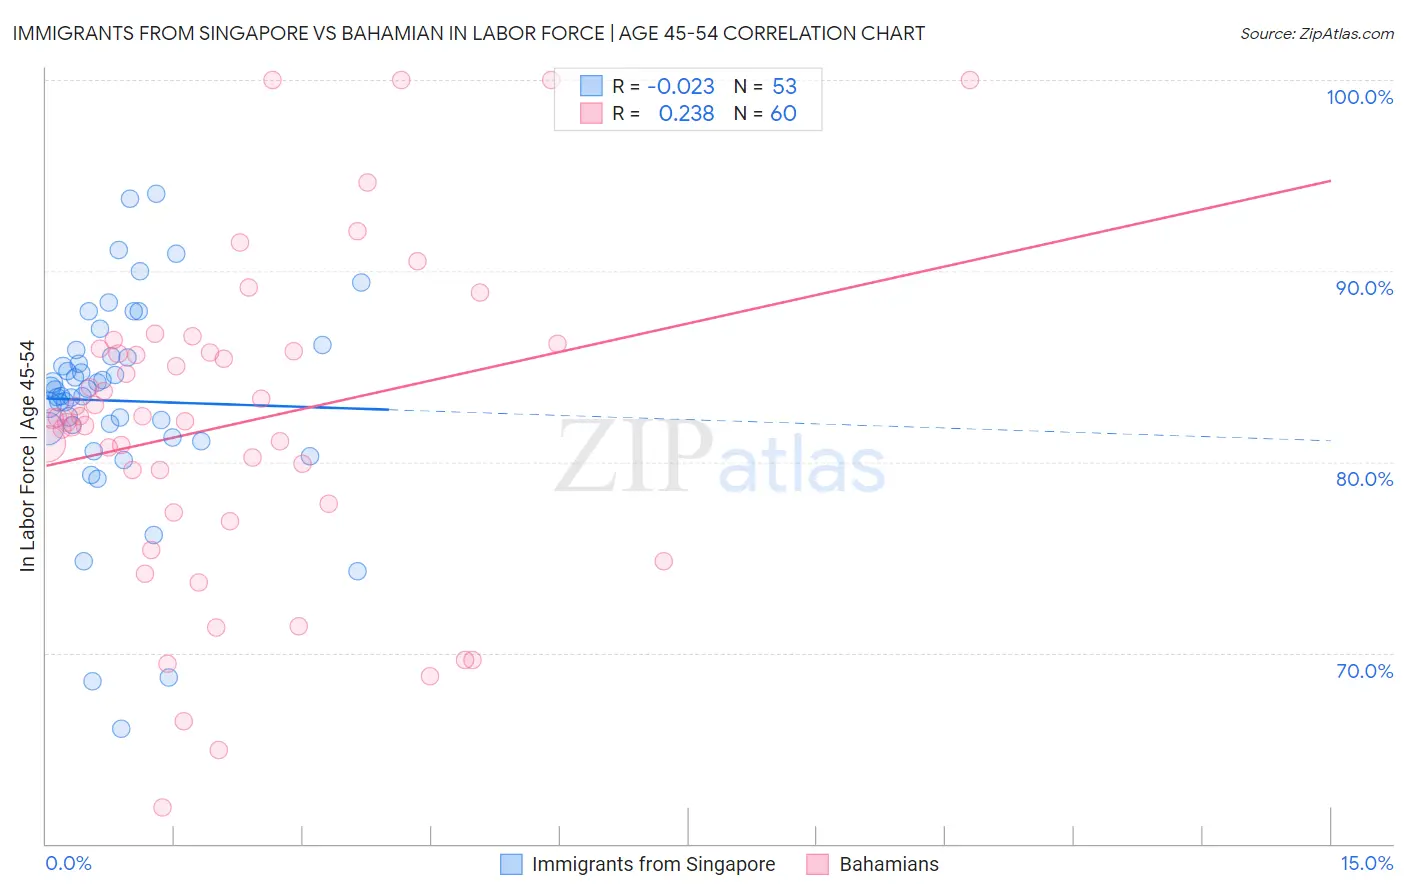
Immigrants from Singapore vs Bahamian In Labor Force | Age 45-54 Correlation Chart
The statistical analysis conducted on geographies consisting of 137,447,922 people shows no correlation between the proportion of Immigrants from Singapore and labor force participation rate among population between the ages 45 and 54 in the United States with a correlation coefficient (R) of -0.023 and weighted average of 83.3%. Similarly, the statistical analysis conducted on geographies consisting of 112,617,260 people shows a weak positive correlation between the proportion of Bahamians and labor force participation rate among population between the ages 45 and 54 in the United States with a correlation coefficient (R) of 0.238 and weighted average of 82.2%, a difference of 1.3%.
In Labor Force | Age 45-54 Correlation Summary
| Measurement | Immigrants from Singapore | Bahamian |
| Minimum | 66.0% | 61.9% |
| Maximum | 94.0% | 100.0% |
| Range | 28.0% | 38.1% |
| Mean | 83.2% | 82.0% |
| Median | 83.7% | 82.3% |
| Interquartile 25% (IQ1) | 81.5% | 77.6% |
| Interquartile 75% (IQ3) | 85.7% | 85.9% |
| Interquartile Range (IQR) | 4.2% | 8.3% |
| Standard Deviation (Sample) | 5.5% | 8.4% |
| Standard Deviation (Population) | 5.5% | 8.3% |
Similar Demographics by In Labor Force | Age 45-54
Demographics Similar to Immigrants from Singapore by In Labor Force | Age 45-54
In terms of in labor force | age 45-54, the demographic groups most similar to Immigrants from Singapore are Albanian (83.3%, a difference of 0.0%), Immigrants from Romania (83.3%, a difference of 0.0%), Immigrants from Middle Africa (83.3%, a difference of 0.010%), Mongolian (83.3%, a difference of 0.010%), and Immigrants from Belarus (83.3%, a difference of 0.010%).
| Demographics | Rating | Rank | In Labor Force | Age 45-54 |
| Immigrants | Argentina | 94.9 /100 | #95 | Exceptional 83.3% |
| Immigrants | Kuwait | 94.8 /100 | #96 | Exceptional 83.3% |
| Palestinians | 94.8 /100 | #97 | Exceptional 83.3% |
| Maltese | 94.4 /100 | #98 | Exceptional 83.3% |
| Immigrants | Middle Africa | 94.3 /100 | #99 | Exceptional 83.3% |
| Mongolians | 94.2 /100 | #100 | Exceptional 83.3% |
| Immigrants | Belarus | 94.1 /100 | #101 | Exceptional 83.3% |
| Immigrants | Singapore | 93.9 /100 | #102 | Exceptional 83.3% |
| Albanians | 93.9 /100 | #103 | Exceptional 83.3% |
| Immigrants | Romania | 93.8 /100 | #104 | Exceptional 83.3% |
| Immigrants | South America | 93.5 /100 | #105 | Exceptional 83.2% |
| Sri Lankans | 93.2 /100 | #106 | Exceptional 83.2% |
| Iranians | 92.9 /100 | #107 | Exceptional 83.2% |
| Slovaks | 92.8 /100 | #108 | Exceptional 83.2% |
| Ukrainians | 92.7 /100 | #109 | Exceptional 83.2% |
Demographics Similar to Bahamians by In Labor Force | Age 45-54
In terms of in labor force | age 45-54, the demographic groups most similar to Bahamians are Panamanian (82.2%, a difference of 0.010%), Immigrants from Ecuador (82.2%, a difference of 0.010%), French (82.2%, a difference of 0.030%), Immigrants (82.1%, a difference of 0.030%), and English (82.2%, a difference of 0.050%).
| Demographics | Rating | Rank | In Labor Force | Age 45-54 |
| Immigrants | Uzbekistan | 5.8 /100 | #213 | Tragic 82.3% |
| Immigrants | Panama | 5.6 /100 | #214 | Tragic 82.2% |
| Iraqis | 5.6 /100 | #215 | Tragic 82.2% |
| Scottish | 5.3 /100 | #216 | Tragic 82.2% |
| Portuguese | 4.7 /100 | #217 | Tragic 82.2% |
| English | 4.4 /100 | #218 | Tragic 82.2% |
| French | 4.1 /100 | #219 | Tragic 82.2% |
| Bahamians | 3.6 /100 | #220 | Tragic 82.2% |
| Panamanians | 3.5 /100 | #221 | Tragic 82.2% |
| Immigrants | Ecuador | 3.4 /100 | #222 | Tragic 82.2% |
| Immigrants | Immigrants | 3.1 /100 | #223 | Tragic 82.1% |
| Immigrants | Jamaica | 2.7 /100 | #224 | Tragic 82.1% |
| Immigrants | Oceania | 2.5 /100 | #225 | Tragic 82.1% |
| Immigrants | Caribbean | 2.5 /100 | #226 | Tragic 82.1% |
| Immigrants | Germany | 2.4 /100 | #227 | Tragic 82.1% |