Kiowa vs Bahamian In Labor Force | Age 45-54
COMPARE
Kiowa
Bahamian
In Labor Force | Age 45-54
In Labor Force | Age 45-54 Comparison
Kiowa
Bahamians
78.3%
IN LABOR FORCE | AGE 45-54
0.0/ 100
METRIC RATING
323rd/ 347
METRIC RANK
82.2%
IN LABOR FORCE | AGE 45-54
3.6/ 100
METRIC RATING
220th/ 347
METRIC RANK
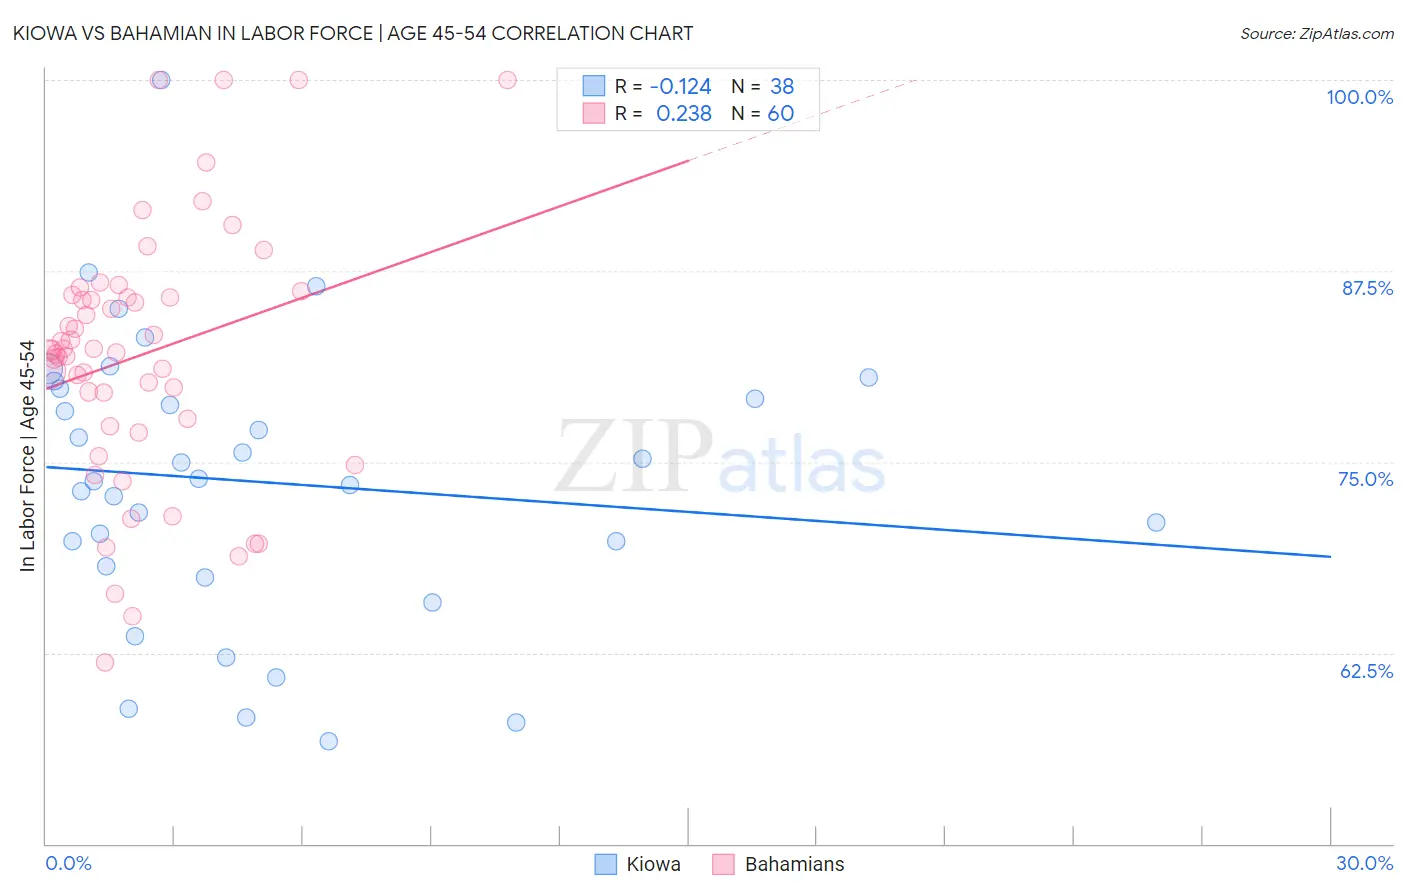
Kiowa vs Bahamian In Labor Force | Age 45-54 Correlation Chart
The statistical analysis conducted on geographies consisting of 56,098,300 people shows a poor negative correlation between the proportion of Kiowa and labor force participation rate among population between the ages 45 and 54 in the United States with a correlation coefficient (R) of -0.124 and weighted average of 78.3%. Similarly, the statistical analysis conducted on geographies consisting of 112,617,260 people shows a weak positive correlation between the proportion of Bahamians and labor force participation rate among population between the ages 45 and 54 in the United States with a correlation coefficient (R) of 0.238 and weighted average of 82.2%, a difference of 5.0%.
In Labor Force | Age 45-54 Correlation Summary
| Measurement | Kiowa | Bahamian |
| Minimum | 56.7% | 61.9% |
| Maximum | 100.0% | 100.0% |
| Range | 43.3% | 38.1% |
| Mean | 73.7% | 82.0% |
| Median | 73.8% | 82.3% |
| Interquartile 25% (IQ1) | 68.2% | 77.6% |
| Interquartile 75% (IQ3) | 79.8% | 85.9% |
| Interquartile Range (IQR) | 11.6% | 8.3% |
| Standard Deviation (Sample) | 9.3% | 8.4% |
| Standard Deviation (Population) | 9.2% | 8.3% |
Similar Demographics by In Labor Force | Age 45-54
Demographics Similar to Kiowa by In Labor Force | Age 45-54
In terms of in labor force | age 45-54, the demographic groups most similar to Kiowa are Dutch West Indian (78.2%, a difference of 0.020%), Crow (78.3%, a difference of 0.080%), Choctaw (78.2%, a difference of 0.11%), Seminole (78.1%, a difference of 0.16%), and Cajun (78.1%, a difference of 0.16%).
| Demographics | Rating | Rank | In Labor Force | Age 45-54 |
| Shoshone | 0.0 /100 | #316 | Tragic 79.3% |
| Comanche | 0.0 /100 | #317 | Tragic 79.2% |
| Chickasaw | 0.0 /100 | #318 | Tragic 79.0% |
| Cherokee | 0.0 /100 | #319 | Tragic 79.0% |
| Yaqui | 0.0 /100 | #320 | Tragic 78.9% |
| Yup'ik | 0.0 /100 | #321 | Tragic 78.6% |
| Crow | 0.0 /100 | #322 | Tragic 78.3% |
| Kiowa | 0.0 /100 | #323 | Tragic 78.3% |
| Dutch West Indians | 0.0 /100 | #324 | Tragic 78.2% |
| Choctaw | 0.0 /100 | #325 | Tragic 78.2% |
| Seminole | 0.0 /100 | #326 | Tragic 78.1% |
| Cajuns | 0.0 /100 | #327 | Tragic 78.1% |
| Sioux | 0.0 /100 | #328 | Tragic 78.0% |
| Creek | 0.0 /100 | #329 | Tragic 77.7% |
| Cheyenne | 0.0 /100 | #330 | Tragic 77.6% |
Demographics Similar to Bahamians by In Labor Force | Age 45-54
In terms of in labor force | age 45-54, the demographic groups most similar to Bahamians are Panamanian (82.2%, a difference of 0.010%), Immigrants from Ecuador (82.2%, a difference of 0.010%), French (82.2%, a difference of 0.030%), Immigrants (82.1%, a difference of 0.030%), and English (82.2%, a difference of 0.050%).
| Demographics | Rating | Rank | In Labor Force | Age 45-54 |
| Immigrants | Uzbekistan | 5.8 /100 | #213 | Tragic 82.3% |
| Immigrants | Panama | 5.6 /100 | #214 | Tragic 82.2% |
| Iraqis | 5.6 /100 | #215 | Tragic 82.2% |
| Scottish | 5.3 /100 | #216 | Tragic 82.2% |
| Portuguese | 4.7 /100 | #217 | Tragic 82.2% |
| English | 4.4 /100 | #218 | Tragic 82.2% |
| French | 4.1 /100 | #219 | Tragic 82.2% |
| Bahamians | 3.6 /100 | #220 | Tragic 82.2% |
| Panamanians | 3.5 /100 | #221 | Tragic 82.2% |
| Immigrants | Ecuador | 3.4 /100 | #222 | Tragic 82.2% |
| Immigrants | Immigrants | 3.1 /100 | #223 | Tragic 82.1% |
| Immigrants | Jamaica | 2.7 /100 | #224 | Tragic 82.1% |
| Immigrants | Oceania | 2.5 /100 | #225 | Tragic 82.1% |
| Immigrants | Caribbean | 2.5 /100 | #226 | Tragic 82.1% |
| Immigrants | Germany | 2.4 /100 | #227 | Tragic 82.1% |