Black/African American vs Immigrants from Congo In Labor Force | Age 30-34
COMPARE
Black/African American
Immigrants from Congo
In Labor Force | Age 30-34
In Labor Force | Age 30-34 Comparison
Blacks/African Americans
Immigrants from Congo
82.8%
IN LABOR FORCE | AGE 30-34
0.0/ 100
METRIC RATING
292nd/ 347
METRIC RANK
84.6%
IN LABOR FORCE | AGE 30-34
29.7/ 100
METRIC RATING
186th/ 347
METRIC RANK
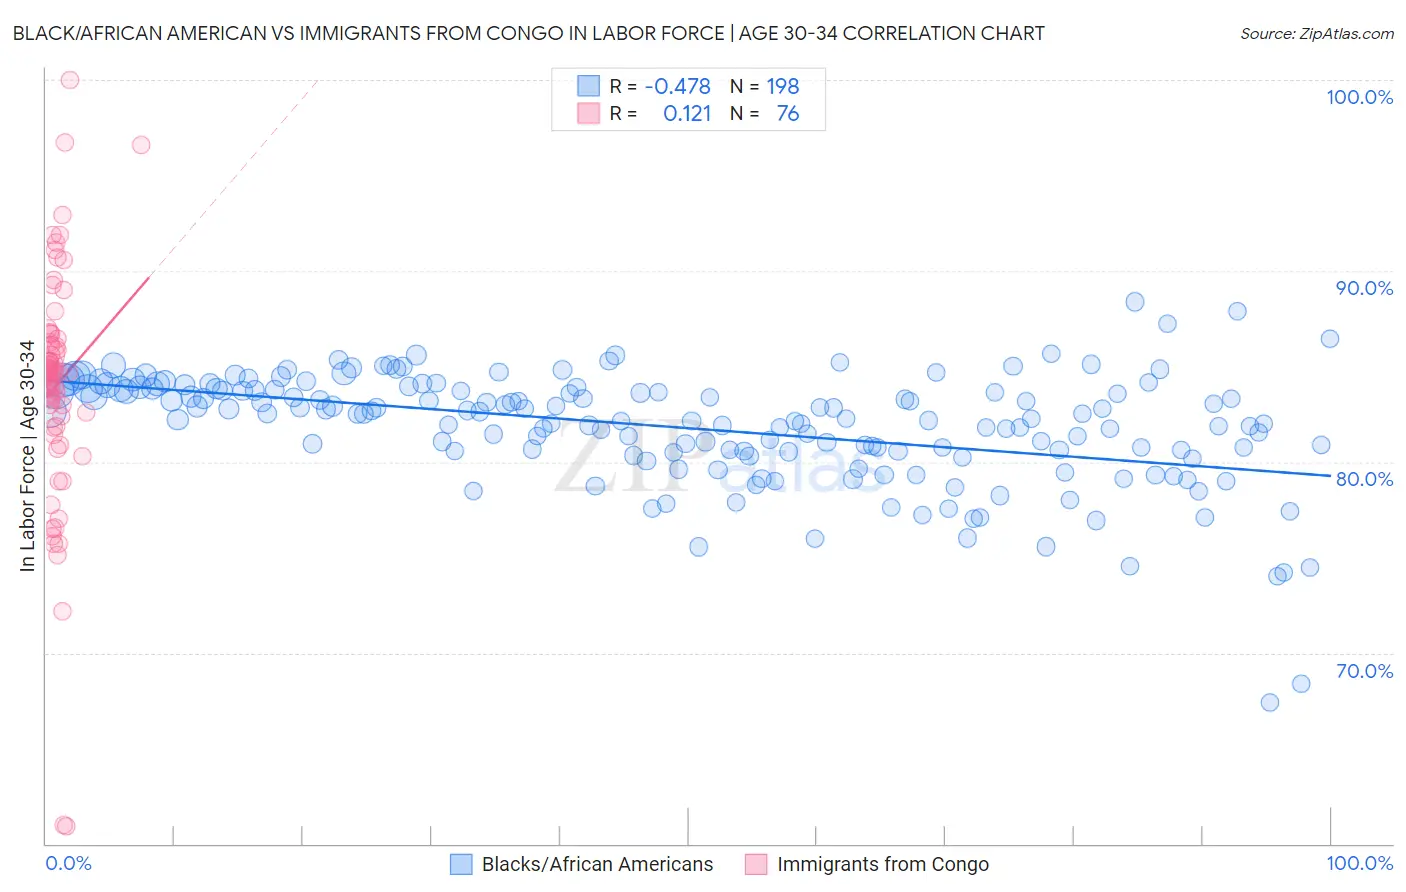
Black/African American vs Immigrants from Congo In Labor Force | Age 30-34 Correlation Chart
The statistical analysis conducted on geographies consisting of 564,859,333 people shows a moderate negative correlation between the proportion of Blacks/African Americans and labor force participation rate among population between the ages 30 and 34 in the United States with a correlation coefficient (R) of -0.478 and weighted average of 82.8%. Similarly, the statistical analysis conducted on geographies consisting of 92,110,351 people shows a poor positive correlation between the proportion of Immigrants from Congo and labor force participation rate among population between the ages 30 and 34 in the United States with a correlation coefficient (R) of 0.121 and weighted average of 84.6%, a difference of 2.1%.
In Labor Force | Age 30-34 Correlation Summary
| Measurement | Black/African American | Immigrants from Congo |
| Minimum | 67.4% | 60.9% |
| Maximum | 88.4% | 100.0% |
| Range | 21.0% | 39.1% |
| Mean | 81.8% | 84.0% |
| Median | 82.5% | 84.7% |
| Interquartile 25% (IQ1) | 80.5% | 82.1% |
| Interquartile 75% (IQ3) | 83.8% | 86.3% |
| Interquartile Range (IQR) | 3.3% | 4.2% |
| Standard Deviation (Sample) | 3.0% | 6.3% |
| Standard Deviation (Population) | 3.0% | 6.2% |
Similar Demographics by In Labor Force | Age 30-34
Demographics Similar to Blacks/African Americans by In Labor Force | Age 30-34
In terms of in labor force | age 30-34, the demographic groups most similar to Blacks/African Americans are Potawatomi (82.8%, a difference of 0.020%), Blackfeet (82.8%, a difference of 0.040%), Nepalese (82.7%, a difference of 0.060%), American (82.7%, a difference of 0.090%), and Pennsylvania German (82.6%, a difference of 0.21%).
| Demographics | Rating | Rank | In Labor Force | Age 30-34 |
| Cree | 0.0 /100 | #285 | Tragic 83.2% |
| Immigrants | Latin America | 0.0 /100 | #286 | Tragic 83.1% |
| Native Hawaiians | 0.0 /100 | #287 | Tragic 83.0% |
| Central American Indians | 0.0 /100 | #288 | Tragic 83.0% |
| Hawaiians | 0.0 /100 | #289 | Tragic 83.0% |
| Blackfeet | 0.0 /100 | #290 | Tragic 82.8% |
| Potawatomi | 0.0 /100 | #291 | Tragic 82.8% |
| Blacks/African Americans | 0.0 /100 | #292 | Tragic 82.8% |
| Nepalese | 0.0 /100 | #293 | Tragic 82.7% |
| Americans | 0.0 /100 | #294 | Tragic 82.7% |
| Pennsylvania Germans | 0.0 /100 | #295 | Tragic 82.6% |
| Chippewa | 0.0 /100 | #296 | Tragic 82.6% |
| Comanche | 0.0 /100 | #297 | Tragic 82.6% |
| Aleuts | 0.0 /100 | #298 | Tragic 82.6% |
| Immigrants | Central America | 0.0 /100 | #299 | Tragic 82.5% |
Demographics Similar to Immigrants from Congo by In Labor Force | Age 30-34
In terms of in labor force | age 30-34, the demographic groups most similar to Immigrants from Congo are Costa Rican (84.6%, a difference of 0.0%), Taiwanese (84.6%, a difference of 0.0%), Immigrants from Philippines (84.6%, a difference of 0.010%), Nigerian (84.5%, a difference of 0.010%), and Immigrants from North America (84.6%, a difference of 0.030%).
| Demographics | Rating | Rank | In Labor Force | Age 30-34 |
| Immigrants | Nigeria | 42.5 /100 | #179 | Average 84.6% |
| Immigrants | Netherlands | 42.1 /100 | #180 | Average 84.6% |
| Moroccans | 40.3 /100 | #181 | Average 84.6% |
| Barbadians | 36.7 /100 | #182 | Fair 84.6% |
| Immigrants | Canada | 35.0 /100 | #183 | Fair 84.6% |
| Immigrants | North America | 33.3 /100 | #184 | Fair 84.6% |
| Immigrants | Philippines | 31.5 /100 | #185 | Fair 84.6% |
| Immigrants | Congo | 29.7 /100 | #186 | Fair 84.6% |
| Costa Ricans | 29.6 /100 | #187 | Fair 84.6% |
| Taiwanese | 29.4 /100 | #188 | Fair 84.6% |
| Nigerians | 28.9 /100 | #189 | Fair 84.5% |
| Immigrants | Zaire | 25.8 /100 | #190 | Fair 84.5% |
| Hungarians | 24.8 /100 | #191 | Fair 84.5% |
| Scandinavians | 24.7 /100 | #192 | Fair 84.5% |
| Immigrants | Costa Rica | 23.9 /100 | #193 | Fair 84.5% |