Black/African American vs Immigrants from Panama In Labor Force | Age 30-34
COMPARE
Black/African American
Immigrants from Panama
In Labor Force | Age 30-34
In Labor Force | Age 30-34 Comparison
Blacks/African Americans
Immigrants from Panama
82.8%
IN LABOR FORCE | AGE 30-34
0.0/ 100
METRIC RATING
292nd/ 347
METRIC RANK
84.3%
IN LABOR FORCE | AGE 30-34
6.3/ 100
METRIC RATING
218th/ 347
METRIC RANK
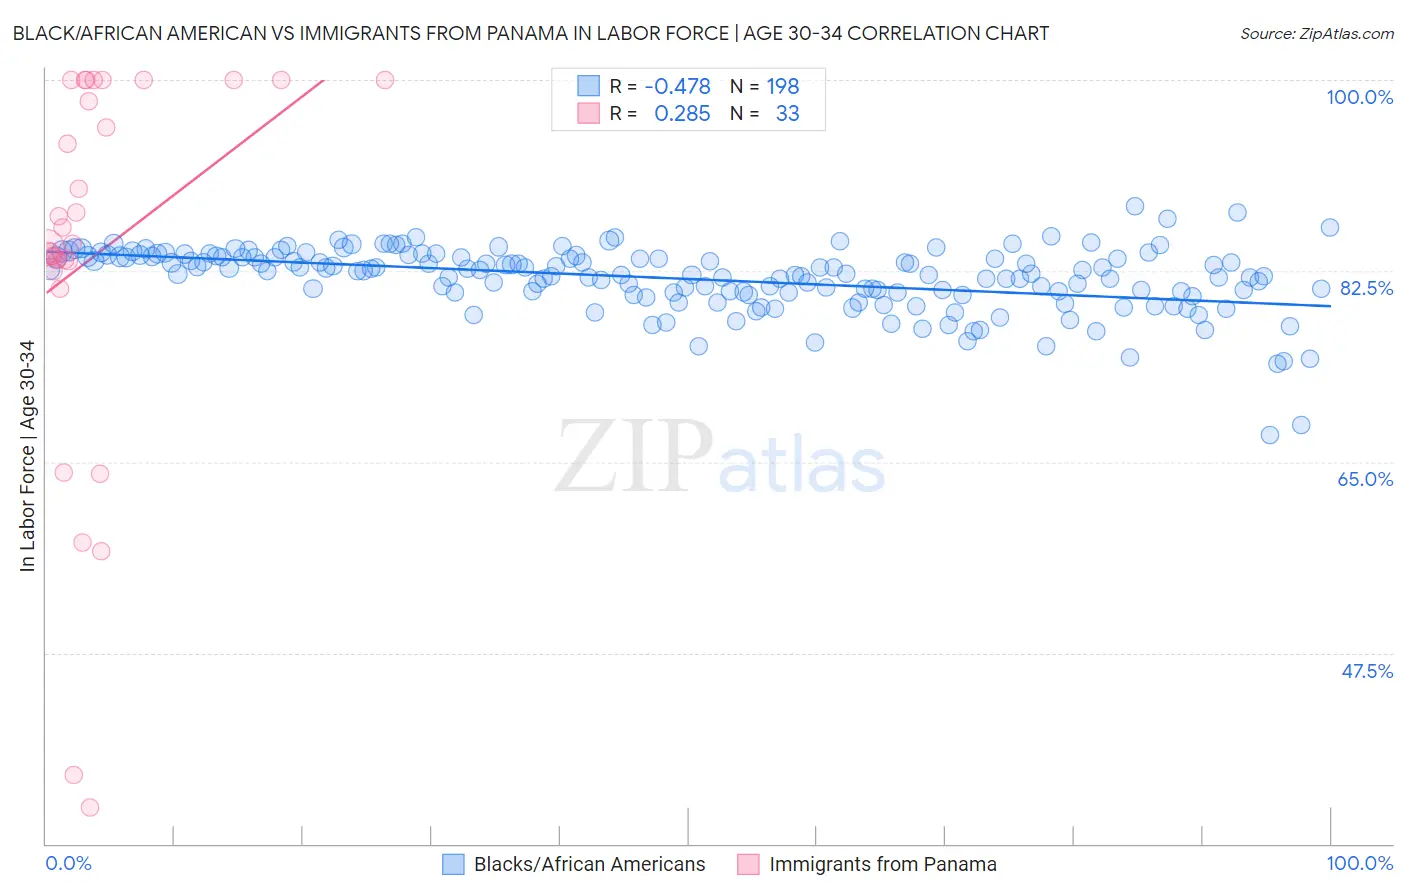
Black/African American vs Immigrants from Panama In Labor Force | Age 30-34 Correlation Chart
The statistical analysis conducted on geographies consisting of 564,859,333 people shows a moderate negative correlation between the proportion of Blacks/African Americans and labor force participation rate among population between the ages 30 and 34 in the United States with a correlation coefficient (R) of -0.478 and weighted average of 82.8%. Similarly, the statistical analysis conducted on geographies consisting of 221,155,968 people shows a weak positive correlation between the proportion of Immigrants from Panama and labor force participation rate among population between the ages 30 and 34 in the United States with a correlation coefficient (R) of 0.285 and weighted average of 84.3%, a difference of 1.8%.
In Labor Force | Age 30-34 Correlation Summary
| Measurement | Black/African American | Immigrants from Panama |
| Minimum | 67.4% | 33.3% |
| Maximum | 88.4% | 100.0% |
| Range | 21.0% | 66.7% |
| Mean | 81.8% | 84.0% |
| Median | 82.5% | 85.0% |
| Interquartile 25% (IQ1) | 80.5% | 82.9% |
| Interquartile 75% (IQ3) | 83.8% | 100.0% |
| Interquartile Range (IQR) | 3.3% | 17.1% |
| Standard Deviation (Sample) | 3.0% | 17.6% |
| Standard Deviation (Population) | 3.0% | 17.3% |
Similar Demographics by In Labor Force | Age 30-34
Demographics Similar to Blacks/African Americans by In Labor Force | Age 30-34
In terms of in labor force | age 30-34, the demographic groups most similar to Blacks/African Americans are Potawatomi (82.8%, a difference of 0.020%), Blackfeet (82.8%, a difference of 0.040%), Nepalese (82.7%, a difference of 0.060%), American (82.7%, a difference of 0.090%), and Pennsylvania German (82.6%, a difference of 0.21%).
| Demographics | Rating | Rank | In Labor Force | Age 30-34 |
| Cree | 0.0 /100 | #285 | Tragic 83.2% |
| Immigrants | Latin America | 0.0 /100 | #286 | Tragic 83.1% |
| Native Hawaiians | 0.0 /100 | #287 | Tragic 83.0% |
| Central American Indians | 0.0 /100 | #288 | Tragic 83.0% |
| Hawaiians | 0.0 /100 | #289 | Tragic 83.0% |
| Blackfeet | 0.0 /100 | #290 | Tragic 82.8% |
| Potawatomi | 0.0 /100 | #291 | Tragic 82.8% |
| Blacks/African Americans | 0.0 /100 | #292 | Tragic 82.8% |
| Nepalese | 0.0 /100 | #293 | Tragic 82.7% |
| Americans | 0.0 /100 | #294 | Tragic 82.7% |
| Pennsylvania Germans | 0.0 /100 | #295 | Tragic 82.6% |
| Chippewa | 0.0 /100 | #296 | Tragic 82.6% |
| Comanche | 0.0 /100 | #297 | Tragic 82.6% |
| Aleuts | 0.0 /100 | #298 | Tragic 82.6% |
| Immigrants | Central America | 0.0 /100 | #299 | Tragic 82.5% |
Demographics Similar to Immigrants from Panama by In Labor Force | Age 30-34
In terms of in labor force | age 30-34, the demographic groups most similar to Immigrants from Panama are Immigrants from Ecuador (84.3%, a difference of 0.020%), Immigrants from Trinidad and Tobago (84.3%, a difference of 0.020%), Swiss (84.3%, a difference of 0.020%), Immigrants from Germany (84.3%, a difference of 0.030%), and European (84.3%, a difference of 0.030%).
| Demographics | Rating | Rank | In Labor Force | Age 30-34 |
| Japanese | 8.8 /100 | #211 | Tragic 84.3% |
| Immigrants | Western Asia | 8.2 /100 | #212 | Tragic 84.3% |
| Immigrants | Jamaica | 7.9 /100 | #213 | Tragic 84.3% |
| Immigrants | Germany | 7.2 /100 | #214 | Tragic 84.3% |
| Europeans | 7.2 /100 | #215 | Tragic 84.3% |
| Immigrants | Ecuador | 7.1 /100 | #216 | Tragic 84.3% |
| Immigrants | Trinidad and Tobago | 7.0 /100 | #217 | Tragic 84.3% |
| Immigrants | Panama | 6.3 /100 | #218 | Tragic 84.3% |
| Swiss | 5.8 /100 | #219 | Tragic 84.3% |
| Danes | 5.3 /100 | #220 | Tragic 84.3% |
| Salvadorans | 3.8 /100 | #221 | Tragic 84.2% |
| Panamanians | 3.8 /100 | #222 | Tragic 84.2% |
| Immigrants | Laos | 3.6 /100 | #223 | Tragic 84.2% |
| Cubans | 3.4 /100 | #224 | Tragic 84.2% |
| Scottish | 3.1 /100 | #225 | Tragic 84.2% |