Blackfeet vs West Indian In Labor Force | Age 30-34
COMPARE
Blackfeet
West Indian
In Labor Force | Age 30-34
In Labor Force | Age 30-34 Comparison
Blackfeet
West Indians
82.8%
IN LABOR FORCE | AGE 30-34
0.0/ 100
METRIC RATING
290th/ 347
METRIC RANK
84.1%
IN LABOR FORCE | AGE 30-34
1.9/ 100
METRIC RATING
233rd/ 347
METRIC RANK
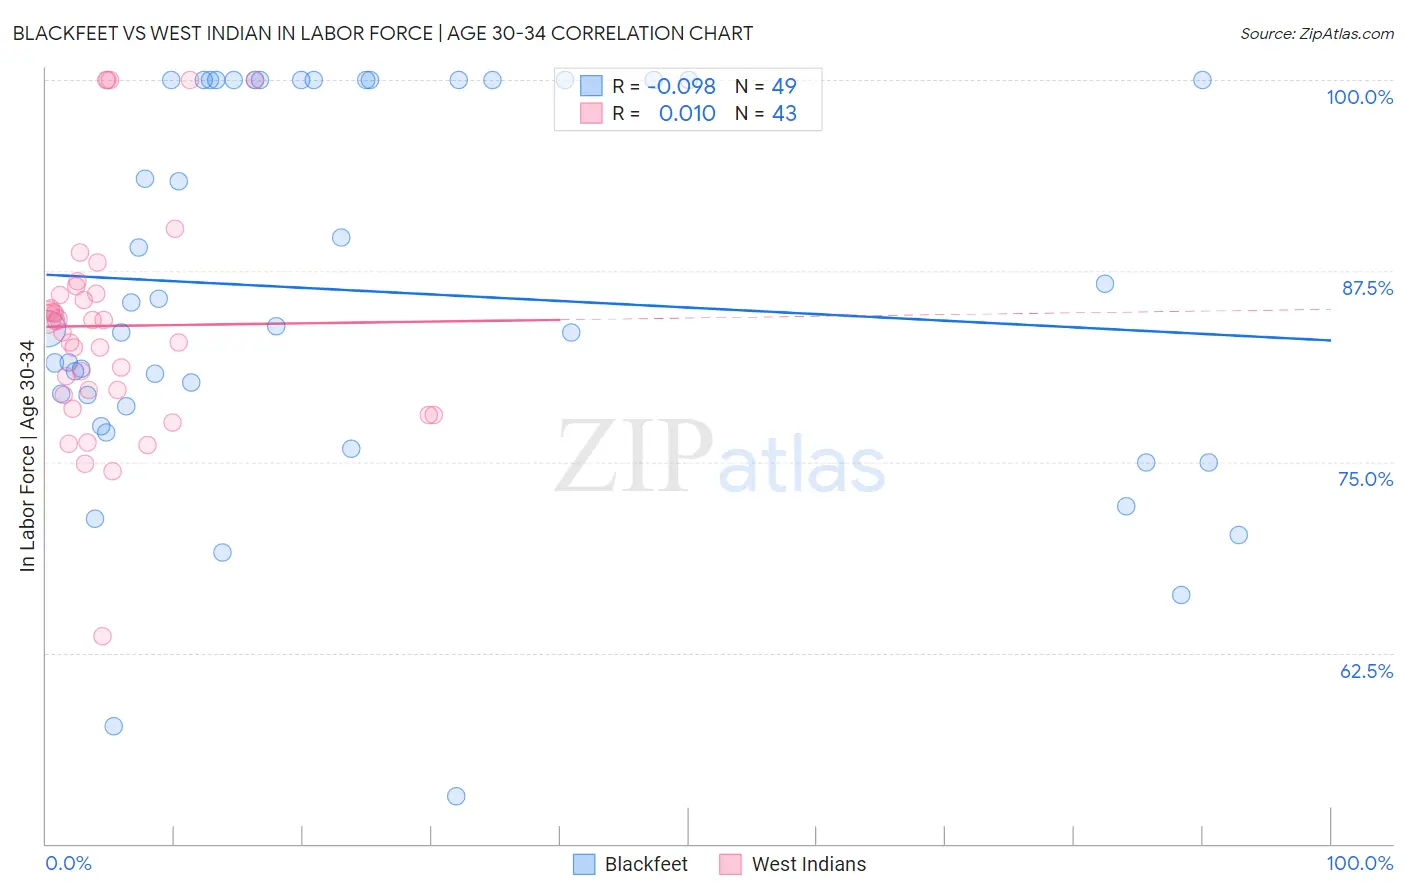
Blackfeet vs West Indian In Labor Force | Age 30-34 Correlation Chart
The statistical analysis conducted on geographies consisting of 309,450,197 people shows a slight negative correlation between the proportion of Blackfeet and labor force participation rate among population between the ages 30 and 34 in the United States with a correlation coefficient (R) of -0.098 and weighted average of 82.8%. Similarly, the statistical analysis conducted on geographies consisting of 253,917,995 people shows no correlation between the proportion of West Indians and labor force participation rate among population between the ages 30 and 34 in the United States with a correlation coefficient (R) of 0.010 and weighted average of 84.1%, a difference of 1.5%.
In Labor Force | Age 30-34 Correlation Summary
| Measurement | Blackfeet | West Indian |
| Minimum | 53.1% | 63.6% |
| Maximum | 100.0% | 100.0% |
| Range | 46.9% | 36.4% |
| Mean | 86.2% | 83.9% |
| Median | 83.9% | 84.2% |
| Interquartile 25% (IQ1) | 78.0% | 79.4% |
| Interquartile 75% (IQ3) | 100.0% | 86.0% |
| Interquartile Range (IQR) | 22.0% | 6.6% |
| Standard Deviation (Sample) | 12.5% | 7.6% |
| Standard Deviation (Population) | 12.4% | 7.5% |
Similar Demographics by In Labor Force | Age 30-34
Demographics Similar to Blackfeet by In Labor Force | Age 30-34
In terms of in labor force | age 30-34, the demographic groups most similar to Blackfeet are Potawatomi (82.8%, a difference of 0.020%), Black/African American (82.8%, a difference of 0.040%), Nepalese (82.7%, a difference of 0.11%), American (82.7%, a difference of 0.13%), and Hawaiian (83.0%, a difference of 0.23%).
| Demographics | Rating | Rank | In Labor Force | Age 30-34 |
| Assyrians/Chaldeans/Syriacs | 0.0 /100 | #283 | Tragic 83.2% |
| Immigrants | Belize | 0.0 /100 | #284 | Tragic 83.2% |
| Cree | 0.0 /100 | #285 | Tragic 83.2% |
| Immigrants | Latin America | 0.0 /100 | #286 | Tragic 83.1% |
| Native Hawaiians | 0.0 /100 | #287 | Tragic 83.0% |
| Central American Indians | 0.0 /100 | #288 | Tragic 83.0% |
| Hawaiians | 0.0 /100 | #289 | Tragic 83.0% |
| Blackfeet | 0.0 /100 | #290 | Tragic 82.8% |
| Potawatomi | 0.0 /100 | #291 | Tragic 82.8% |
| Blacks/African Americans | 0.0 /100 | #292 | Tragic 82.8% |
| Nepalese | 0.0 /100 | #293 | Tragic 82.7% |
| Americans | 0.0 /100 | #294 | Tragic 82.7% |
| Pennsylvania Germans | 0.0 /100 | #295 | Tragic 82.6% |
| Chippewa | 0.0 /100 | #296 | Tragic 82.6% |
| Comanche | 0.0 /100 | #297 | Tragic 82.6% |
Demographics Similar to West Indians by In Labor Force | Age 30-34
In terms of in labor force | age 30-34, the demographic groups most similar to West Indians are Immigrants (84.1%, a difference of 0.010%), Haitian (84.1%, a difference of 0.010%), French American Indian (84.1%, a difference of 0.020%), Malaysian (84.1%, a difference of 0.030%), and U.S. Virgin Islander (84.1%, a difference of 0.040%).
| Demographics | Rating | Rank | In Labor Force | Age 30-34 |
| Immigrants | El Salvador | 3.0 /100 | #226 | Tragic 84.2% |
| Immigrants | Cuba | 3.0 /100 | #227 | Tragic 84.2% |
| Immigrants | Haiti | 2.8 /100 | #228 | Tragic 84.2% |
| Welsh | 2.7 /100 | #229 | Tragic 84.2% |
| Immigrants | Bahamas | 2.6 /100 | #230 | Tragic 84.1% |
| Malaysians | 2.2 /100 | #231 | Tragic 84.1% |
| Immigrants | Immigrants | 2.0 /100 | #232 | Tragic 84.1% |
| West Indians | 1.9 /100 | #233 | Tragic 84.1% |
| Haitians | 1.8 /100 | #234 | Tragic 84.1% |
| French American Indians | 1.7 /100 | #235 | Tragic 84.1% |
| U.S. Virgin Islanders | 1.5 /100 | #236 | Tragic 84.1% |
| Celtics | 1.4 /100 | #237 | Tragic 84.1% |
| Immigrants | Barbados | 1.4 /100 | #238 | Tragic 84.0% |
| English | 1.4 /100 | #239 | Tragic 84.0% |
| Venezuelans | 1.3 /100 | #240 | Tragic 84.0% |