Sri Lankan vs West Indian In Labor Force | Age 30-34
COMPARE
Sri Lankan
West Indian
In Labor Force | Age 30-34
In Labor Force | Age 30-34 Comparison
Sri Lankans
West Indians
85.0%
IN LABOR FORCE | AGE 30-34
87.8/ 100
METRIC RATING
138th/ 347
METRIC RANK
84.1%
IN LABOR FORCE | AGE 30-34
1.9/ 100
METRIC RATING
233rd/ 347
METRIC RANK
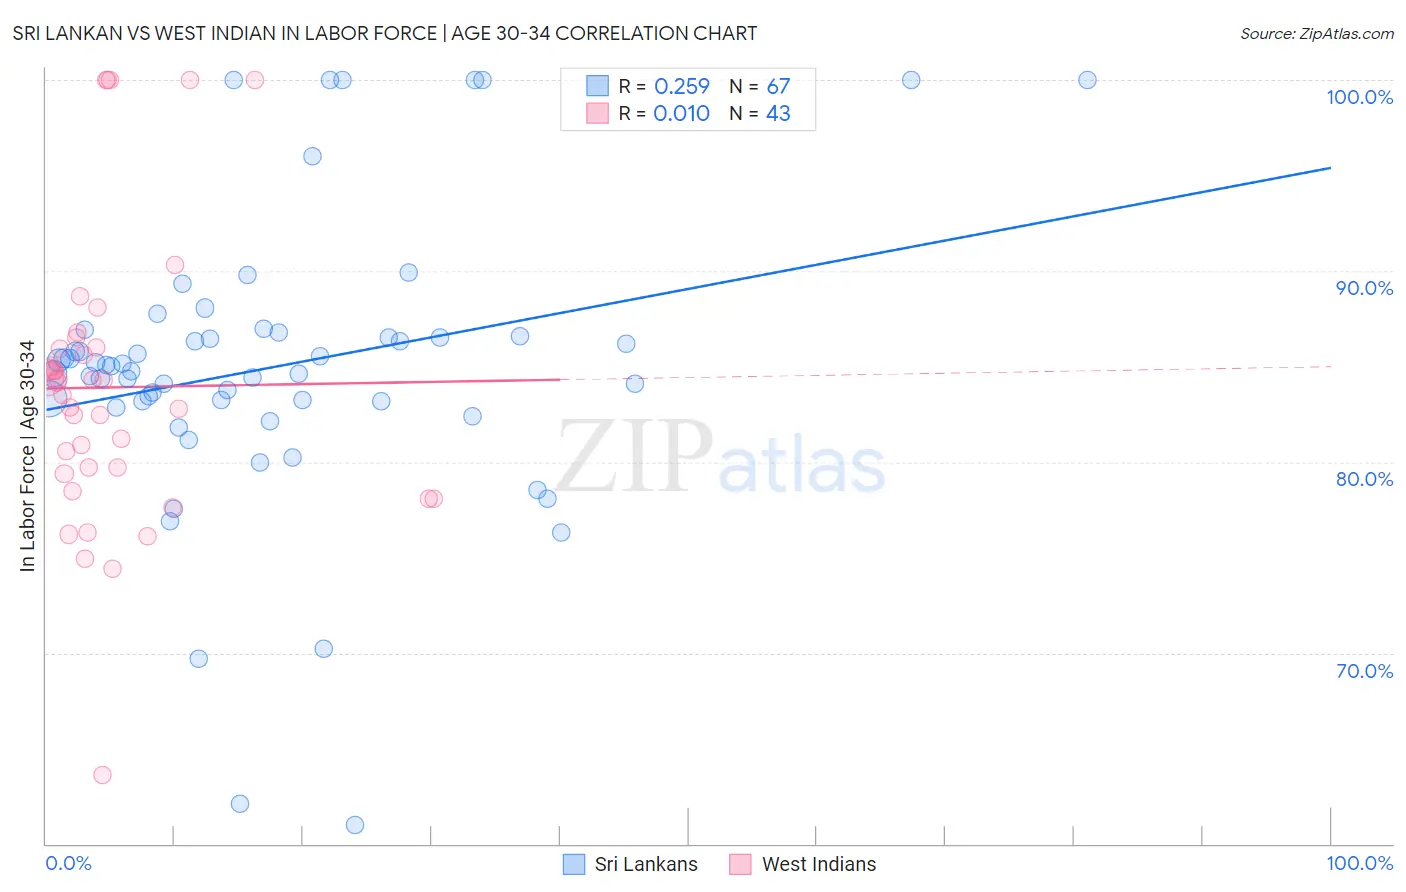
Sri Lankan vs West Indian In Labor Force | Age 30-34 Correlation Chart
The statistical analysis conducted on geographies consisting of 440,177,214 people shows a weak positive correlation between the proportion of Sri Lankans and labor force participation rate among population between the ages 30 and 34 in the United States with a correlation coefficient (R) of 0.259 and weighted average of 85.0%. Similarly, the statistical analysis conducted on geographies consisting of 253,917,995 people shows no correlation between the proportion of West Indians and labor force participation rate among population between the ages 30 and 34 in the United States with a correlation coefficient (R) of 0.010 and weighted average of 84.1%, a difference of 1.1%.
In Labor Force | Age 30-34 Correlation Summary
| Measurement | Sri Lankan | West Indian |
| Minimum | 61.0% | 63.6% |
| Maximum | 100.0% | 100.0% |
| Range | 39.0% | 36.4% |
| Mean | 85.0% | 83.9% |
| Median | 85.0% | 84.2% |
| Interquartile 25% (IQ1) | 83.2% | 79.4% |
| Interquartile 75% (IQ3) | 86.6% | 86.0% |
| Interquartile Range (IQR) | 3.4% | 6.6% |
| Standard Deviation (Sample) | 7.6% | 7.6% |
| Standard Deviation (Population) | 7.5% | 7.5% |
Similar Demographics by In Labor Force | Age 30-34
Demographics Similar to Sri Lankans by In Labor Force | Age 30-34
In terms of in labor force | age 30-34, the demographic groups most similar to Sri Lankans are South African (85.0%, a difference of 0.0%), Jordanian (85.0%, a difference of 0.010%), Bhutanese (85.0%, a difference of 0.010%), Immigrants from Chile (85.0%, a difference of 0.020%), and Immigrants from Asia (85.0%, a difference of 0.020%).
| Demographics | Rating | Rank | In Labor Force | Age 30-34 |
| Chinese | 89.6 /100 | #131 | Excellent 85.0% |
| Immigrants | Israel | 89.5 /100 | #132 | Excellent 85.0% |
| New Zealanders | 89.5 /100 | #133 | Excellent 85.0% |
| Immigrants | Chile | 89.2 /100 | #134 | Excellent 85.0% |
| Immigrants | Asia | 88.9 /100 | #135 | Excellent 85.0% |
| Jordanians | 88.6 /100 | #136 | Excellent 85.0% |
| South Africans | 88.0 /100 | #137 | Excellent 85.0% |
| Sri Lankans | 87.8 /100 | #138 | Excellent 85.0% |
| Bhutanese | 87.5 /100 | #139 | Excellent 85.0% |
| Immigrants | Vietnam | 86.5 /100 | #140 | Excellent 85.0% |
| Chileans | 85.3 /100 | #141 | Excellent 84.9% |
| Immigrants | Indonesia | 84.3 /100 | #142 | Excellent 84.9% |
| Colombians | 82.2 /100 | #143 | Excellent 84.9% |
| Uruguayans | 78.5 /100 | #144 | Good 84.9% |
| Palestinians | 77.7 /100 | #145 | Good 84.9% |
Demographics Similar to West Indians by In Labor Force | Age 30-34
In terms of in labor force | age 30-34, the demographic groups most similar to West Indians are Immigrants (84.1%, a difference of 0.010%), Haitian (84.1%, a difference of 0.010%), French American Indian (84.1%, a difference of 0.020%), Malaysian (84.1%, a difference of 0.030%), and U.S. Virgin Islander (84.1%, a difference of 0.040%).
| Demographics | Rating | Rank | In Labor Force | Age 30-34 |
| Immigrants | El Salvador | 3.0 /100 | #226 | Tragic 84.2% |
| Immigrants | Cuba | 3.0 /100 | #227 | Tragic 84.2% |
| Immigrants | Haiti | 2.8 /100 | #228 | Tragic 84.2% |
| Welsh | 2.7 /100 | #229 | Tragic 84.2% |
| Immigrants | Bahamas | 2.6 /100 | #230 | Tragic 84.1% |
| Malaysians | 2.2 /100 | #231 | Tragic 84.1% |
| Immigrants | Immigrants | 2.0 /100 | #232 | Tragic 84.1% |
| West Indians | 1.9 /100 | #233 | Tragic 84.1% |
| Haitians | 1.8 /100 | #234 | Tragic 84.1% |
| French American Indians | 1.7 /100 | #235 | Tragic 84.1% |
| U.S. Virgin Islanders | 1.5 /100 | #236 | Tragic 84.1% |
| Celtics | 1.4 /100 | #237 | Tragic 84.1% |
| Immigrants | Barbados | 1.4 /100 | #238 | Tragic 84.0% |
| English | 1.4 /100 | #239 | Tragic 84.0% |
| Venezuelans | 1.3 /100 | #240 | Tragic 84.0% |