Yugoslavian vs West Indian In Labor Force | Age 30-34
COMPARE
Yugoslavian
West Indian
In Labor Force | Age 30-34
In Labor Force | Age 30-34 Comparison
Yugoslavians
West Indians
85.1%
IN LABOR FORCE | AGE 30-34
94.7/ 100
METRIC RATING
114th/ 347
METRIC RANK
84.1%
IN LABOR FORCE | AGE 30-34
1.9/ 100
METRIC RATING
233rd/ 347
METRIC RANK
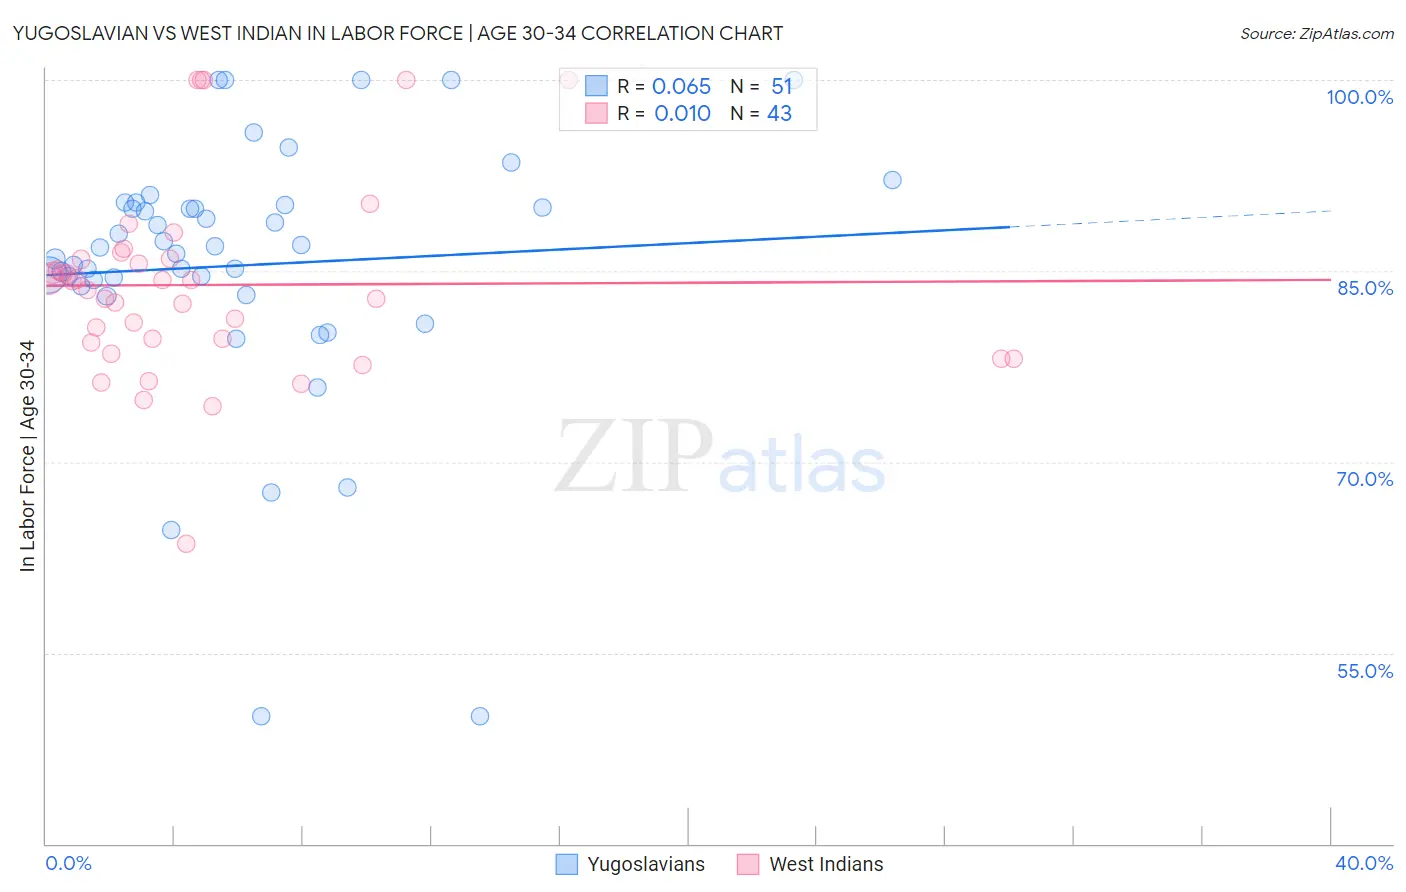
Yugoslavian vs West Indian In Labor Force | Age 30-34 Correlation Chart
The statistical analysis conducted on geographies consisting of 285,635,237 people shows a slight positive correlation between the proportion of Yugoslavians and labor force participation rate among population between the ages 30 and 34 in the United States with a correlation coefficient (R) of 0.065 and weighted average of 85.1%. Similarly, the statistical analysis conducted on geographies consisting of 253,917,995 people shows no correlation between the proportion of West Indians and labor force participation rate among population between the ages 30 and 34 in the United States with a correlation coefficient (R) of 0.010 and weighted average of 84.1%, a difference of 1.2%.
In Labor Force | Age 30-34 Correlation Summary
| Measurement | Yugoslavian | West Indian |
| Minimum | 50.0% | 63.6% |
| Maximum | 100.0% | 100.0% |
| Range | 50.0% | 36.4% |
| Mean | 85.4% | 83.9% |
| Median | 86.8% | 84.2% |
| Interquartile 25% (IQ1) | 83.8% | 79.4% |
| Interquartile 75% (IQ3) | 90.2% | 86.0% |
| Interquartile Range (IQR) | 6.4% | 6.6% |
| Standard Deviation (Sample) | 10.4% | 7.6% |
| Standard Deviation (Population) | 10.3% | 7.5% |
Similar Demographics by In Labor Force | Age 30-34
Demographics Similar to Yugoslavians by In Labor Force | Age 30-34
In terms of in labor force | age 30-34, the demographic groups most similar to Yugoslavians are Immigrants from Hungary (85.1%, a difference of 0.0%), Immigrants from Romania (85.1%, a difference of 0.0%), Immigrants from South Central Asia (85.1%, a difference of 0.0%), Immigrants from Scotland (85.1%, a difference of 0.010%), and Egyptian (85.1%, a difference of 0.010%).
| Demographics | Rating | Rank | In Labor Force | Age 30-34 |
| Immigrants | Northern Africa | 96.3 /100 | #107 | Exceptional 85.2% |
| Immigrants | Zimbabwe | 95.8 /100 | #108 | Exceptional 85.1% |
| Argentineans | 95.8 /100 | #109 | Exceptional 85.1% |
| Immigrants | South Africa | 95.3 /100 | #110 | Exceptional 85.1% |
| Immigrants | Scotland | 94.9 /100 | #111 | Exceptional 85.1% |
| Immigrants | Hungary | 94.8 /100 | #112 | Exceptional 85.1% |
| Immigrants | Romania | 94.7 /100 | #113 | Exceptional 85.1% |
| Yugoslavians | 94.7 /100 | #114 | Exceptional 85.1% |
| Immigrants | South Central Asia | 94.6 /100 | #115 | Exceptional 85.1% |
| Egyptians | 94.5 /100 | #116 | Exceptional 85.1% |
| Immigrants | Denmark | 94.3 /100 | #117 | Exceptional 85.1% |
| Immigrants | Malaysia | 94.2 /100 | #118 | Exceptional 85.1% |
| Asians | 93.4 /100 | #119 | Exceptional 85.1% |
| Immigrants | Southern Europe | 93.3 /100 | #120 | Exceptional 85.1% |
| Immigrants | Egypt | 93.2 /100 | #121 | Exceptional 85.1% |
Demographics Similar to West Indians by In Labor Force | Age 30-34
In terms of in labor force | age 30-34, the demographic groups most similar to West Indians are Immigrants (84.1%, a difference of 0.010%), Haitian (84.1%, a difference of 0.010%), French American Indian (84.1%, a difference of 0.020%), Malaysian (84.1%, a difference of 0.030%), and U.S. Virgin Islander (84.1%, a difference of 0.040%).
| Demographics | Rating | Rank | In Labor Force | Age 30-34 |
| Immigrants | El Salvador | 3.0 /100 | #226 | Tragic 84.2% |
| Immigrants | Cuba | 3.0 /100 | #227 | Tragic 84.2% |
| Immigrants | Haiti | 2.8 /100 | #228 | Tragic 84.2% |
| Welsh | 2.7 /100 | #229 | Tragic 84.2% |
| Immigrants | Bahamas | 2.6 /100 | #230 | Tragic 84.1% |
| Malaysians | 2.2 /100 | #231 | Tragic 84.1% |
| Immigrants | Immigrants | 2.0 /100 | #232 | Tragic 84.1% |
| West Indians | 1.9 /100 | #233 | Tragic 84.1% |
| Haitians | 1.8 /100 | #234 | Tragic 84.1% |
| French American Indians | 1.7 /100 | #235 | Tragic 84.1% |
| U.S. Virgin Islanders | 1.5 /100 | #236 | Tragic 84.1% |
| Celtics | 1.4 /100 | #237 | Tragic 84.1% |
| Immigrants | Barbados | 1.4 /100 | #238 | Tragic 84.0% |
| English | 1.4 /100 | #239 | Tragic 84.0% |
| Venezuelans | 1.3 /100 | #240 | Tragic 84.0% |