Blackfeet vs Immigrants from Southern Europe In Labor Force | Age 30-34
COMPARE
Blackfeet
Immigrants from Southern Europe
In Labor Force | Age 30-34
In Labor Force | Age 30-34 Comparison
Blackfeet
Immigrants from Southern Europe
82.8%
IN LABOR FORCE | AGE 30-34
0.0/ 100
METRIC RATING
290th/ 347
METRIC RANK
85.1%
IN LABOR FORCE | AGE 30-34
93.3/ 100
METRIC RATING
120th/ 347
METRIC RANK
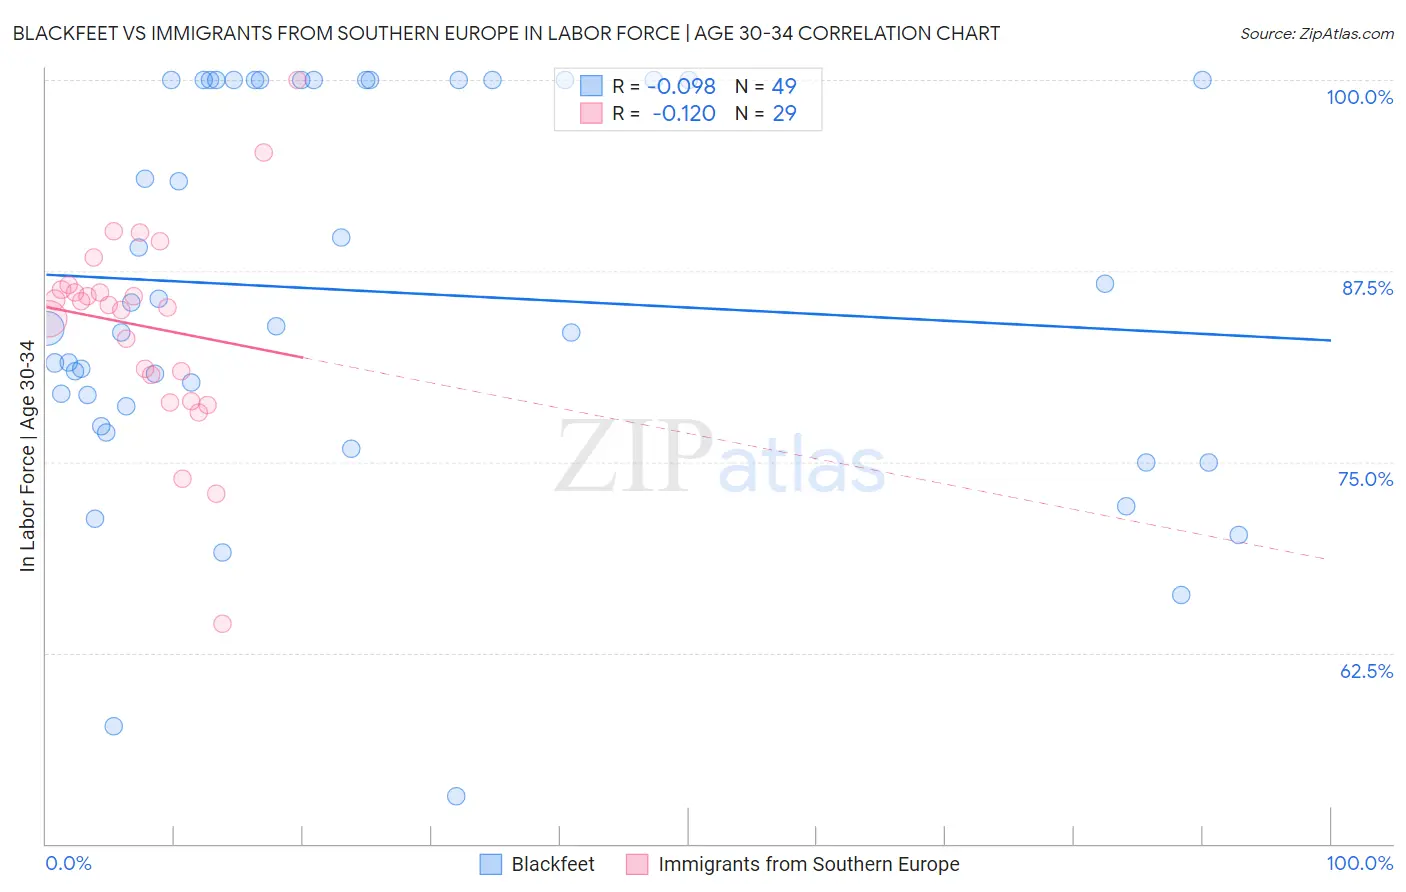
Blackfeet vs Immigrants from Southern Europe In Labor Force | Age 30-34 Correlation Chart
The statistical analysis conducted on geographies consisting of 309,450,197 people shows a slight negative correlation between the proportion of Blackfeet and labor force participation rate among population between the ages 30 and 34 in the United States with a correlation coefficient (R) of -0.098 and weighted average of 82.8%. Similarly, the statistical analysis conducted on geographies consisting of 402,565,184 people shows a poor negative correlation between the proportion of Immigrants from Southern Europe and labor force participation rate among population between the ages 30 and 34 in the United States with a correlation coefficient (R) of -0.120 and weighted average of 85.1%, a difference of 2.7%.
In Labor Force | Age 30-34 Correlation Summary
| Measurement | Blackfeet | Immigrants from Southern Europe |
| Minimum | 53.1% | 64.4% |
| Maximum | 100.0% | 100.0% |
| Range | 46.9% | 35.6% |
| Mean | 86.2% | 83.9% |
| Median | 83.9% | 85.3% |
| Interquartile 25% (IQ1) | 78.0% | 79.8% |
| Interquartile 75% (IQ3) | 100.0% | 86.4% |
| Interquartile Range (IQR) | 22.0% | 6.6% |
| Standard Deviation (Sample) | 12.5% | 6.8% |
| Standard Deviation (Population) | 12.4% | 6.7% |
Similar Demographics by In Labor Force | Age 30-34
Demographics Similar to Blackfeet by In Labor Force | Age 30-34
In terms of in labor force | age 30-34, the demographic groups most similar to Blackfeet are Potawatomi (82.8%, a difference of 0.020%), Black/African American (82.8%, a difference of 0.040%), Nepalese (82.7%, a difference of 0.11%), American (82.7%, a difference of 0.13%), and Hawaiian (83.0%, a difference of 0.23%).
| Demographics | Rating | Rank | In Labor Force | Age 30-34 |
| Assyrians/Chaldeans/Syriacs | 0.0 /100 | #283 | Tragic 83.2% |
| Immigrants | Belize | 0.0 /100 | #284 | Tragic 83.2% |
| Cree | 0.0 /100 | #285 | Tragic 83.2% |
| Immigrants | Latin America | 0.0 /100 | #286 | Tragic 83.1% |
| Native Hawaiians | 0.0 /100 | #287 | Tragic 83.0% |
| Central American Indians | 0.0 /100 | #288 | Tragic 83.0% |
| Hawaiians | 0.0 /100 | #289 | Tragic 83.0% |
| Blackfeet | 0.0 /100 | #290 | Tragic 82.8% |
| Potawatomi | 0.0 /100 | #291 | Tragic 82.8% |
| Blacks/African Americans | 0.0 /100 | #292 | Tragic 82.8% |
| Nepalese | 0.0 /100 | #293 | Tragic 82.7% |
| Americans | 0.0 /100 | #294 | Tragic 82.7% |
| Pennsylvania Germans | 0.0 /100 | #295 | Tragic 82.6% |
| Chippewa | 0.0 /100 | #296 | Tragic 82.6% |
| Comanche | 0.0 /100 | #297 | Tragic 82.6% |
Demographics Similar to Immigrants from Southern Europe by In Labor Force | Age 30-34
In terms of in labor force | age 30-34, the demographic groups most similar to Immigrants from Southern Europe are Asian (85.1%, a difference of 0.0%), Immigrants from Egypt (85.1%, a difference of 0.0%), Immigrants from Kuwait (85.1%, a difference of 0.020%), Immigrants from Denmark (85.1%, a difference of 0.030%), and Immigrants from Malaysia (85.1%, a difference of 0.030%).
| Demographics | Rating | Rank | In Labor Force | Age 30-34 |
| Immigrants | Romania | 94.7 /100 | #113 | Exceptional 85.1% |
| Yugoslavians | 94.7 /100 | #114 | Exceptional 85.1% |
| Immigrants | South Central Asia | 94.6 /100 | #115 | Exceptional 85.1% |
| Egyptians | 94.5 /100 | #116 | Exceptional 85.1% |
| Immigrants | Denmark | 94.3 /100 | #117 | Exceptional 85.1% |
| Immigrants | Malaysia | 94.2 /100 | #118 | Exceptional 85.1% |
| Asians | 93.4 /100 | #119 | Exceptional 85.1% |
| Immigrants | Southern Europe | 93.3 /100 | #120 | Exceptional 85.1% |
| Immigrants | Egypt | 93.2 /100 | #121 | Exceptional 85.1% |
| Immigrants | Kuwait | 92.6 /100 | #122 | Exceptional 85.1% |
| Armenians | 92.2 /100 | #123 | Exceptional 85.0% |
| Australians | 92.0 /100 | #124 | Exceptional 85.0% |
| Immigrants | Jordan | 91.5 /100 | #125 | Exceptional 85.0% |
| Austrians | 90.9 /100 | #126 | Exceptional 85.0% |
| Slavs | 90.7 /100 | #127 | Exceptional 85.0% |