Blackfeet vs West Indian Cognitive Disability
COMPARE
Blackfeet
West Indian
Cognitive Disability
Cognitive Disability Comparison
Blackfeet
West Indians
18.3%
COGNITIVE DISABILITY
0.0/ 100
METRIC RATING
297th/ 347
METRIC RANK
18.1%
COGNITIVE DISABILITY
0.1/ 100
METRIC RATING
280th/ 347
METRIC RANK
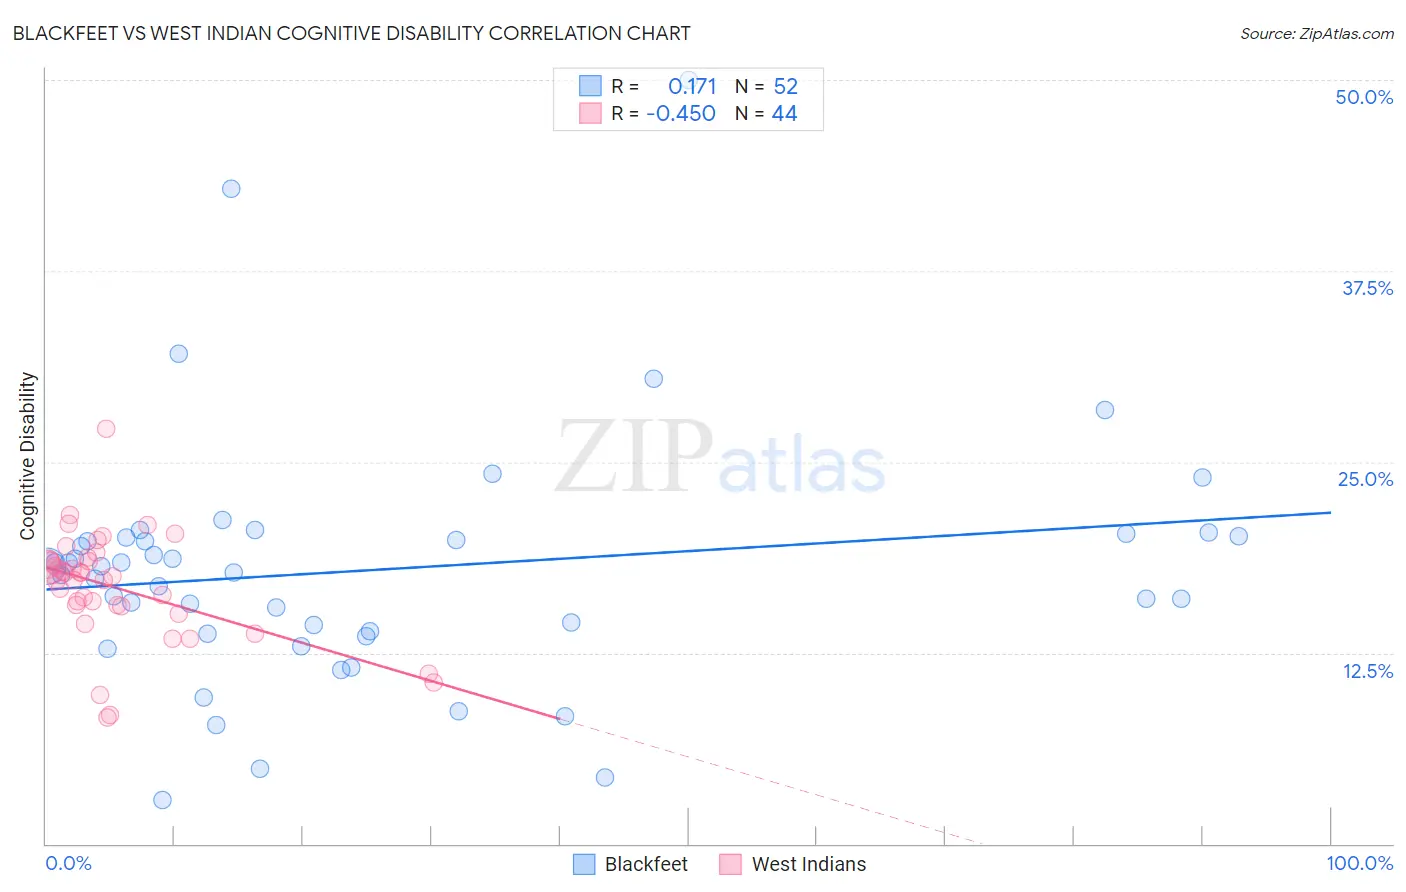
Blackfeet vs West Indian Cognitive Disability Correlation Chart
The statistical analysis conducted on geographies consisting of 309,516,270 people shows a poor positive correlation between the proportion of Blackfeet and percentage of population with cognitive disability in the United States with a correlation coefficient (R) of 0.171 and weighted average of 18.3%. Similarly, the statistical analysis conducted on geographies consisting of 254,021,216 people shows a moderate negative correlation between the proportion of West Indians and percentage of population with cognitive disability in the United States with a correlation coefficient (R) of -0.450 and weighted average of 18.1%, a difference of 0.97%.
Cognitive Disability Correlation Summary
| Measurement | Blackfeet | West Indian |
| Minimum | 2.8% | 8.2% |
| Maximum | 50.0% | 27.1% |
| Range | 47.2% | 18.9% |
| Mean | 17.9% | 16.8% |
| Median | 18.0% | 17.5% |
| Interquartile 25% (IQ1) | 13.8% | 15.6% |
| Interquartile 75% (IQ3) | 20.1% | 18.5% |
| Interquartile Range (IQR) | 6.3% | 2.9% |
| Standard Deviation (Sample) | 8.2% | 3.6% |
| Standard Deviation (Population) | 8.1% | 3.5% |
Demographics Similar to Blackfeet and West Indians by Cognitive Disability
In terms of cognitive disability, the demographic groups most similar to Blackfeet are Japanese (18.3%, a difference of 0.0%), Immigrants from Burma/Myanmar (18.2%, a difference of 0.14%), German Russian (18.2%, a difference of 0.17%), British West Indian (18.2%, a difference of 0.34%), and Iroquois (18.2%, a difference of 0.41%). Similarly, the demographic groups most similar to West Indians are Chippewa (18.1%, a difference of 0.010%), Immigrants from Micronesia (18.1%, a difference of 0.060%), Yakama (18.1%, a difference of 0.12%), Immigrants from Cambodia (18.1%, a difference of 0.14%), and Nigerian (18.1%, a difference of 0.17%).
| Demographics | Rating | Rank | Cognitive Disability |
| Immigrants | Micronesia | 0.2 /100 | #278 | Tragic 18.1% |
| Chippewa | 0.1 /100 | #279 | Tragic 18.1% |
| West Indians | 0.1 /100 | #280 | Tragic 18.1% |
| Yakama | 0.1 /100 | #281 | Tragic 18.1% |
| Immigrants | Cambodia | 0.1 /100 | #282 | Tragic 18.1% |
| Nigerians | 0.1 /100 | #283 | Tragic 18.1% |
| Immigrants | Uganda | 0.1 /100 | #284 | Tragic 18.1% |
| Bermudans | 0.1 /100 | #285 | Tragic 18.1% |
| Kenyans | 0.1 /100 | #286 | Tragic 18.1% |
| Dutch West Indians | 0.1 /100 | #287 | Tragic 18.1% |
| Immigrants | West Indies | 0.1 /100 | #288 | Tragic 18.1% |
| Natives/Alaskans | 0.1 /100 | #289 | Tragic 18.1% |
| Immigrants | Africa | 0.1 /100 | #290 | Tragic 18.1% |
| Ottawa | 0.1 /100 | #291 | Tragic 18.2% |
| Iroquois | 0.1 /100 | #292 | Tragic 18.2% |
| Central American Indians | 0.1 /100 | #293 | Tragic 18.2% |
| British West Indians | 0.1 /100 | #294 | Tragic 18.2% |
| German Russians | 0.0 /100 | #295 | Tragic 18.2% |
| Immigrants | Burma/Myanmar | 0.0 /100 | #296 | Tragic 18.2% |
| Blackfeet | 0.0 /100 | #297 | Tragic 18.3% |
| Japanese | 0.0 /100 | #298 | Tragic 18.3% |