Blackfeet vs West Indian Householder Income Over 65 years
COMPARE
Blackfeet
West Indian
Householder Income Over 65 years
Householder Income Over 65 years Comparison
Blackfeet
West Indians
$54,029
HOUSEHOLDER INCOME OVER 65 YEARS
0.1/ 100
METRIC RATING
279th/ 347
METRIC RANK
$54,936
HOUSEHOLDER INCOME OVER 65 YEARS
0.2/ 100
METRIC RATING
259th/ 347
METRIC RANK
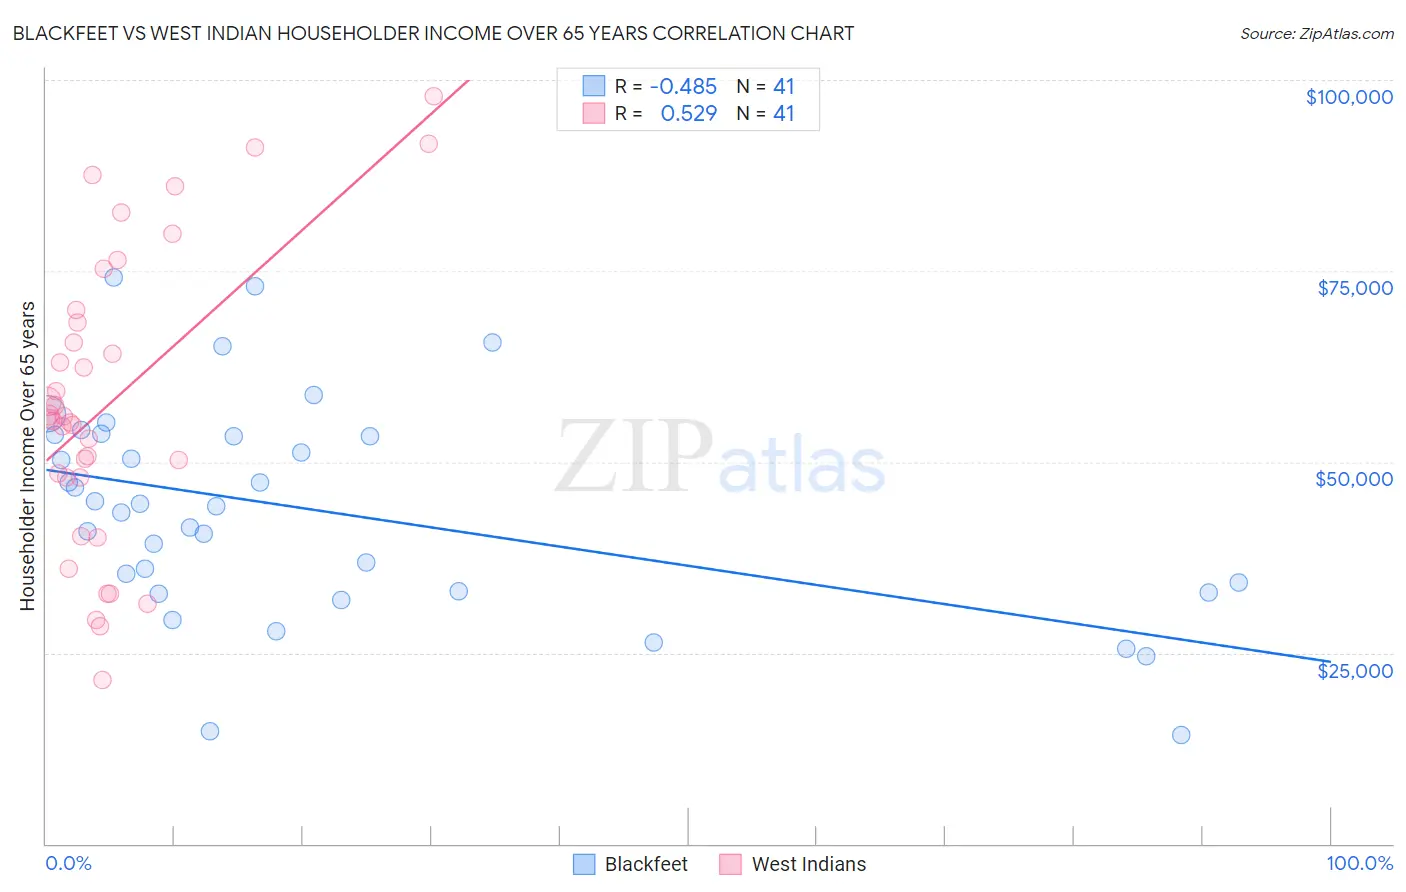
Blackfeet vs West Indian Householder Income Over 65 years Correlation Chart
The statistical analysis conducted on geographies consisting of 308,657,896 people shows a moderate negative correlation between the proportion of Blackfeet and household income with householder over the age of 65 in the United States with a correlation coefficient (R) of -0.485 and weighted average of $54,029. Similarly, the statistical analysis conducted on geographies consisting of 253,324,861 people shows a substantial positive correlation between the proportion of West Indians and household income with householder over the age of 65 in the United States with a correlation coefficient (R) of 0.529 and weighted average of $54,936, a difference of 1.7%.
Householder Income Over 65 years Correlation Summary
| Measurement | Blackfeet | West Indian |
| Minimum | $14,196 | $21,368 |
| Maximum | $74,087 | $97,868 |
| Range | $59,891 | $76,500 |
| Mean | $43,504 | $57,688 |
| Median | $44,167 | $55,650 |
| Interquartile 25% (IQ1) | $32,958 | $47,931 |
| Interquartile 75% (IQ3) | $53,466 | $69,062 |
| Interquartile Range (IQR) | $20,508 | $21,132 |
| Standard Deviation (Sample) | $14,024 | $18,888 |
| Standard Deviation (Population) | $13,852 | $18,656 |
Demographics Similar to Blackfeet and West Indians by Householder Income Over 65 years
In terms of householder income over 65 years, the demographic groups most similar to Blackfeet are Immigrants from Ecuador ($54,030, a difference of 0.0%), Cheyenne ($54,096, a difference of 0.12%), Cree ($54,129, a difference of 0.18%), Cherokee ($54,133, a difference of 0.19%), and Barbadian ($54,163, a difference of 0.25%). Similarly, the demographic groups most similar to West Indians are Immigrants from West Indies ($54,927, a difference of 0.020%), Comanche ($54,922, a difference of 0.030%), Bangladeshi ($54,719, a difference of 0.40%), French American Indian ($54,699, a difference of 0.43%), and Apache ($54,668, a difference of 0.49%).
| Demographics | Rating | Rank | Householder Income Over 65 years |
| West Indians | 0.2 /100 | #259 | Tragic $54,936 |
| Immigrants | West Indies | 0.2 /100 | #260 | Tragic $54,927 |
| Comanche | 0.2 /100 | #261 | Tragic $54,922 |
| Bangladeshis | 0.1 /100 | #262 | Tragic $54,719 |
| French American Indians | 0.1 /100 | #263 | Tragic $54,699 |
| Apache | 0.1 /100 | #264 | Tragic $54,668 |
| Belizeans | 0.1 /100 | #265 | Tragic $54,580 |
| Jamaicans | 0.1 /100 | #266 | Tragic $54,560 |
| Guatemalans | 0.1 /100 | #267 | Tragic $54,526 |
| Immigrants | Zaire | 0.1 /100 | #268 | Tragic $54,512 |
| Nicaraguans | 0.1 /100 | #269 | Tragic $54,474 |
| Immigrants | Senegal | 0.1 /100 | #270 | Tragic $54,447 |
| Liberians | 0.1 /100 | #271 | Tragic $54,356 |
| Potawatomi | 0.1 /100 | #272 | Tragic $54,212 |
| Indonesians | 0.1 /100 | #273 | Tragic $54,176 |
| Barbadians | 0.1 /100 | #274 | Tragic $54,163 |
| Cherokee | 0.1 /100 | #275 | Tragic $54,133 |
| Cree | 0.1 /100 | #276 | Tragic $54,129 |
| Cheyenne | 0.1 /100 | #277 | Tragic $54,096 |
| Immigrants | Ecuador | 0.1 /100 | #278 | Tragic $54,030 |
| Blackfeet | 0.1 /100 | #279 | Tragic $54,029 |