Blackfeet vs British West Indian In Labor Force | Age 30-34
COMPARE
Blackfeet
British West Indian
In Labor Force | Age 30-34
In Labor Force | Age 30-34 Comparison
Blackfeet
British West Indians
82.8%
IN LABOR FORCE | AGE 30-34
0.0/ 100
METRIC RATING
290th/ 347
METRIC RANK
84.0%
IN LABOR FORCE | AGE 30-34
0.8/ 100
METRIC RATING
247th/ 347
METRIC RANK
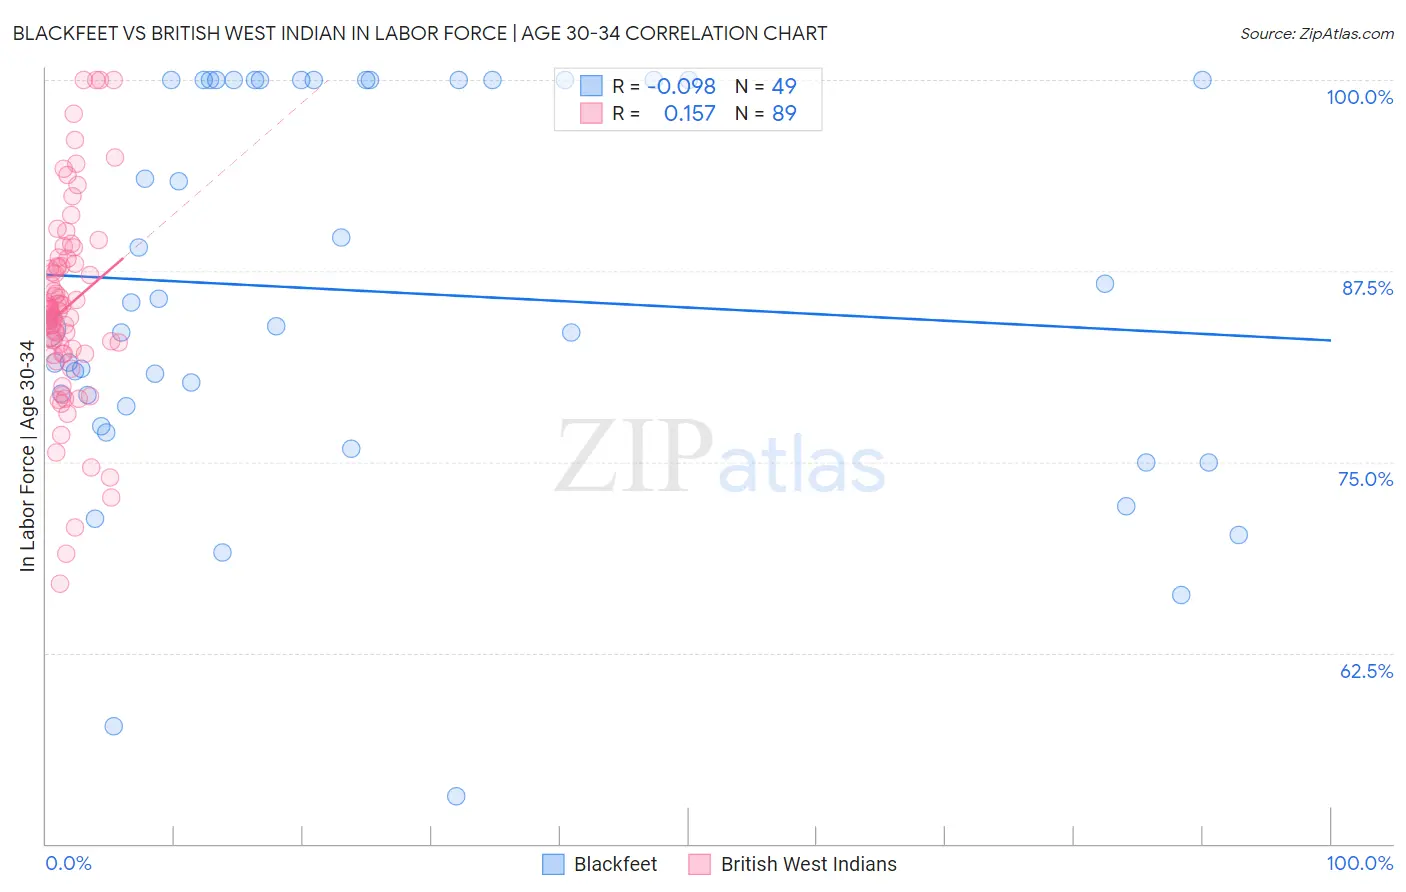
Blackfeet vs British West Indian In Labor Force | Age 30-34 Correlation Chart
The statistical analysis conducted on geographies consisting of 309,450,197 people shows a slight negative correlation between the proportion of Blackfeet and labor force participation rate among population between the ages 30 and 34 in the United States with a correlation coefficient (R) of -0.098 and weighted average of 82.8%. Similarly, the statistical analysis conducted on geographies consisting of 152,639,615 people shows a poor positive correlation between the proportion of British West Indians and labor force participation rate among population between the ages 30 and 34 in the United States with a correlation coefficient (R) of 0.157 and weighted average of 84.0%, a difference of 1.4%.
In Labor Force | Age 30-34 Correlation Summary
| Measurement | Blackfeet | British West Indian |
| Minimum | 53.1% | 67.0% |
| Maximum | 100.0% | 100.0% |
| Range | 46.9% | 33.0% |
| Mean | 86.2% | 85.1% |
| Median | 83.9% | 84.9% |
| Interquartile 25% (IQ1) | 78.0% | 82.2% |
| Interquartile 75% (IQ3) | 100.0% | 87.9% |
| Interquartile Range (IQR) | 22.0% | 5.7% |
| Standard Deviation (Sample) | 12.5% | 6.4% |
| Standard Deviation (Population) | 12.4% | 6.4% |
Similar Demographics by In Labor Force | Age 30-34
Demographics Similar to Blackfeet by In Labor Force | Age 30-34
In terms of in labor force | age 30-34, the demographic groups most similar to Blackfeet are Potawatomi (82.8%, a difference of 0.020%), Black/African American (82.8%, a difference of 0.040%), Nepalese (82.7%, a difference of 0.11%), American (82.7%, a difference of 0.13%), and Hawaiian (83.0%, a difference of 0.23%).
| Demographics | Rating | Rank | In Labor Force | Age 30-34 |
| Assyrians/Chaldeans/Syriacs | 0.0 /100 | #283 | Tragic 83.2% |
| Immigrants | Belize | 0.0 /100 | #284 | Tragic 83.2% |
| Cree | 0.0 /100 | #285 | Tragic 83.2% |
| Immigrants | Latin America | 0.0 /100 | #286 | Tragic 83.1% |
| Native Hawaiians | 0.0 /100 | #287 | Tragic 83.0% |
| Central American Indians | 0.0 /100 | #288 | Tragic 83.0% |
| Hawaiians | 0.0 /100 | #289 | Tragic 83.0% |
| Blackfeet | 0.0 /100 | #290 | Tragic 82.8% |
| Potawatomi | 0.0 /100 | #291 | Tragic 82.8% |
| Blacks/African Americans | 0.0 /100 | #292 | Tragic 82.8% |
| Nepalese | 0.0 /100 | #293 | Tragic 82.7% |
| Americans | 0.0 /100 | #294 | Tragic 82.7% |
| Pennsylvania Germans | 0.0 /100 | #295 | Tragic 82.6% |
| Chippewa | 0.0 /100 | #296 | Tragic 82.6% |
| Comanche | 0.0 /100 | #297 | Tragic 82.6% |
Demographics Similar to British West Indians by In Labor Force | Age 30-34
In terms of in labor force | age 30-34, the demographic groups most similar to British West Indians are Portuguese (84.0%, a difference of 0.010%), Basque (84.0%, a difference of 0.020%), Immigrants from Venezuela (84.0%, a difference of 0.020%), Central American (84.0%, a difference of 0.020%), and Immigrants from Dominica (84.0%, a difference of 0.020%).
| Demographics | Rating | Rank | In Labor Force | Age 30-34 |
| Venezuelans | 1.3 /100 | #240 | Tragic 84.0% |
| Immigrants | Portugal | 1.2 /100 | #241 | Tragic 84.0% |
| Immigrants | Oceania | 1.1 /100 | #242 | Tragic 84.0% |
| Immigrants | Caribbean | 1.1 /100 | #243 | Tragic 84.0% |
| Basques | 0.9 /100 | #244 | Tragic 84.0% |
| Immigrants | Venezuela | 0.9 /100 | #245 | Tragic 84.0% |
| Central Americans | 0.9 /100 | #246 | Tragic 84.0% |
| British West Indians | 0.8 /100 | #247 | Tragic 84.0% |
| Portuguese | 0.8 /100 | #248 | Tragic 84.0% |
| Immigrants | Dominica | 0.7 /100 | #249 | Tragic 84.0% |
| Immigrants | Iraq | 0.7 /100 | #250 | Tragic 83.9% |
| Nicaraguans | 0.6 /100 | #251 | Tragic 83.9% |
| Bahamians | 0.6 /100 | #252 | Tragic 83.9% |
| Immigrants | Nicaragua | 0.6 /100 | #253 | Tragic 83.9% |
| Immigrants | St. Vincent and the Grenadines | 0.5 /100 | #254 | Tragic 83.9% |