Canadian vs Costa Rican In Labor Force | Age > 16
COMPARE
Canadian
Costa Rican
In Labor Force | Age > 16
In Labor Force | Age > 16 Comparison
Canadians
Costa Ricans
64.1%
IN LABOR FORCE | AGE > 16
0.5/ 100
METRIC RATING
267th/ 347
METRIC RANK
65.6%
IN LABOR FORCE | AGE > 16
93.2/ 100
METRIC RATING
134th/ 347
METRIC RANK
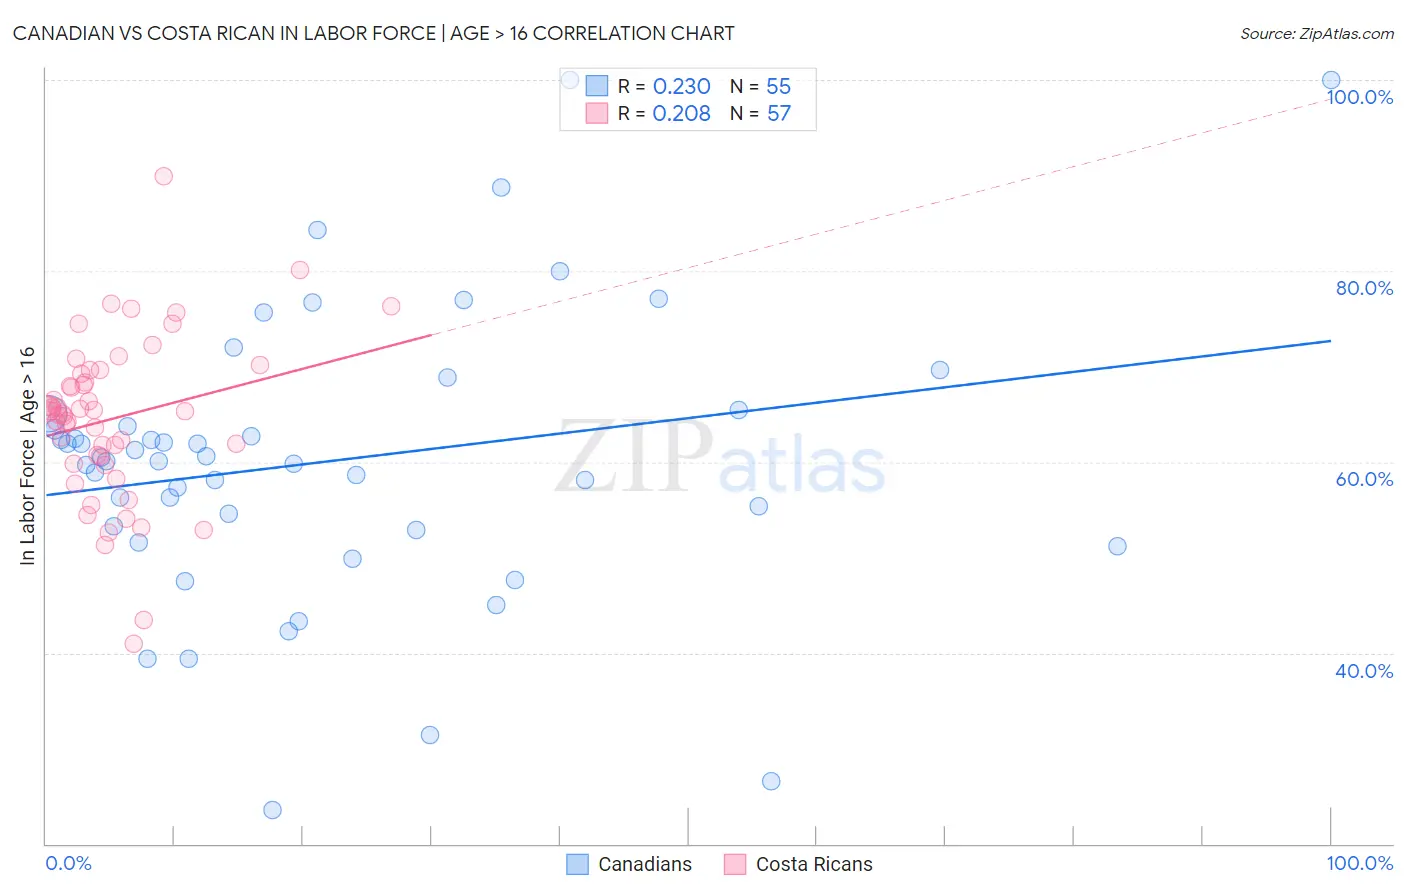
Canadian vs Costa Rican In Labor Force | Age > 16 Correlation Chart
The statistical analysis conducted on geographies consisting of 437,567,270 people shows a weak positive correlation between the proportion of Canadians and labor force participation rate among population ages 16 and over in the United States with a correlation coefficient (R) of 0.230 and weighted average of 64.1%. Similarly, the statistical analysis conducted on geographies consisting of 253,602,231 people shows a weak positive correlation between the proportion of Costa Ricans and labor force participation rate among population ages 16 and over in the United States with a correlation coefficient (R) of 0.208 and weighted average of 65.6%, a difference of 2.3%.
In Labor Force | Age > 16 Correlation Summary
| Measurement | Canadian | Costa Rican |
| Minimum | 23.5% | 40.9% |
| Maximum | 100.0% | 89.9% |
| Range | 76.5% | 49.0% |
| Mean | 60.1% | 64.5% |
| Median | 60.1% | 65.3% |
| Interquartile 25% (IQ1) | 52.8% | 60.2% |
| Interquartile 75% (IQ3) | 65.0% | 69.4% |
| Interquartile Range (IQR) | 12.2% | 9.2% |
| Standard Deviation (Sample) | 15.1% | 8.5% |
| Standard Deviation (Population) | 14.9% | 8.5% |
Similar Demographics by In Labor Force | Age > 16
Demographics Similar to Canadians by In Labor Force | Age > 16
In terms of in labor force | age > 16, the demographic groups most similar to Canadians are Spaniard (64.1%, a difference of 0.0%), Immigrants from England (64.2%, a difference of 0.010%), Cuban (64.2%, a difference of 0.020%), Irish (64.1%, a difference of 0.040%), and Dutch (64.2%, a difference of 0.060%).
| Demographics | Rating | Rank | In Labor Force | Age > 16 |
| Marshallese | 0.7 /100 | #260 | Tragic 64.2% |
| Basques | 0.7 /100 | #261 | Tragic 64.2% |
| Finns | 0.7 /100 | #262 | Tragic 64.2% |
| Bahamians | 0.6 /100 | #263 | Tragic 64.2% |
| Dutch | 0.6 /100 | #264 | Tragic 64.2% |
| Cubans | 0.5 /100 | #265 | Tragic 64.2% |
| Immigrants | England | 0.5 /100 | #266 | Tragic 64.2% |
| Canadians | 0.5 /100 | #267 | Tragic 64.1% |
| Spaniards | 0.5 /100 | #268 | Tragic 64.1% |
| Irish | 0.4 /100 | #269 | Tragic 64.1% |
| Guyanese | 0.4 /100 | #270 | Tragic 64.1% |
| Dominicans | 0.4 /100 | #271 | Tragic 64.1% |
| Native Hawaiians | 0.3 /100 | #272 | Tragic 64.1% |
| Hmong | 0.3 /100 | #273 | Tragic 64.1% |
| Immigrants | Cuba | 0.3 /100 | #274 | Tragic 64.1% |
Demographics Similar to Costa Ricans by In Labor Force | Age > 16
In terms of in labor force | age > 16, the demographic groups most similar to Costa Ricans are Immigrants from Lithuania (65.6%, a difference of 0.010%), Guatemalan (65.6%, a difference of 0.030%), Immigrants from Argentina (65.6%, a difference of 0.030%), Immigrants from North Macedonia (65.6%, a difference of 0.040%), and Guamanian/Chamorro (65.6%, a difference of 0.040%).
| Demographics | Rating | Rank | In Labor Force | Age > 16 |
| Immigrants | Eastern Asia | 94.9 /100 | #127 | Exceptional 65.7% |
| Ecuadorians | 94.7 /100 | #128 | Exceptional 65.6% |
| Immigrants | Philippines | 94.5 /100 | #129 | Exceptional 65.6% |
| Immigrants | Guatemala | 94.4 /100 | #130 | Exceptional 65.6% |
| Icelanders | 94.3 /100 | #131 | Exceptional 65.6% |
| Immigrants | North Macedonia | 94.1 /100 | #132 | Exceptional 65.6% |
| Immigrants | Lithuania | 93.5 /100 | #133 | Exceptional 65.6% |
| Costa Ricans | 93.2 /100 | #134 | Exceptional 65.6% |
| Guatemalans | 92.5 /100 | #135 | Exceptional 65.6% |
| Immigrants | Argentina | 92.4 /100 | #136 | Exceptional 65.6% |
| Guamanians/Chamorros | 92.4 /100 | #137 | Exceptional 65.6% |
| Immigrants | West Indies | 92.0 /100 | #138 | Exceptional 65.6% |
| Immigrants | Taiwan | 90.8 /100 | #139 | Exceptional 65.5% |
| Immigrants | Costa Rica | 90.8 /100 | #140 | Exceptional 65.5% |
| Samoans | 90.5 /100 | #141 | Exceptional 65.5% |