Immigrants from Greece vs Costa Rican In Labor Force | Age > 16
COMPARE
Immigrants from Greece
Costa Rican
In Labor Force | Age > 16
In Labor Force | Age > 16 Comparison
Immigrants from Greece
Costa Ricans
65.0%
IN LABOR FORCE | AGE > 16
34.3/ 100
METRIC RATING
189th/ 347
METRIC RANK
65.6%
IN LABOR FORCE | AGE > 16
93.2/ 100
METRIC RATING
134th/ 347
METRIC RANK
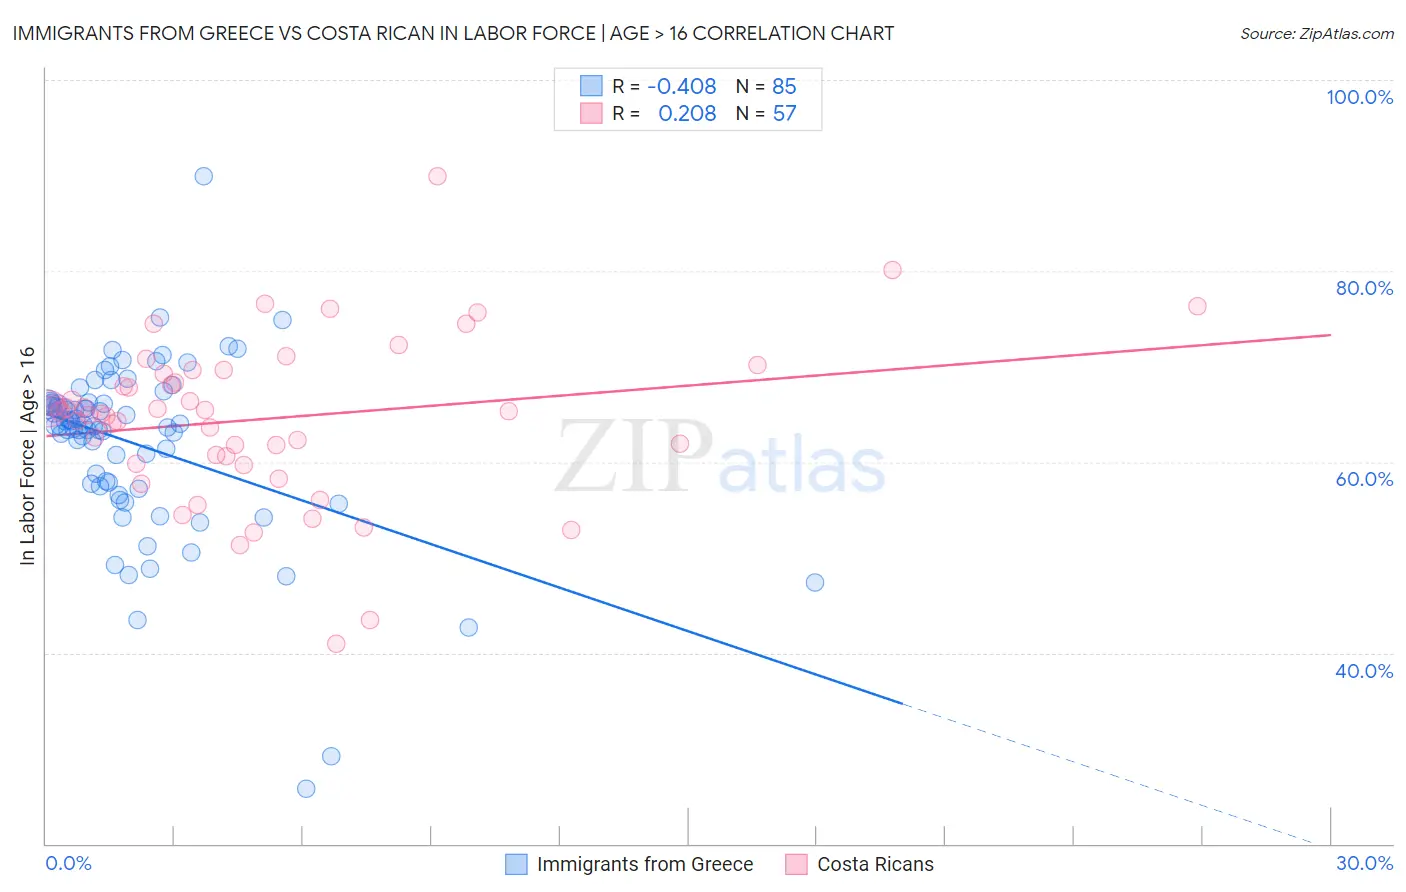
Immigrants from Greece vs Costa Rican In Labor Force | Age > 16 Correlation Chart
The statistical analysis conducted on geographies consisting of 216,877,956 people shows a moderate negative correlation between the proportion of Immigrants from Greece and labor force participation rate among population ages 16 and over in the United States with a correlation coefficient (R) of -0.408 and weighted average of 65.0%. Similarly, the statistical analysis conducted on geographies consisting of 253,602,231 people shows a weak positive correlation between the proportion of Costa Ricans and labor force participation rate among population ages 16 and over in the United States with a correlation coefficient (R) of 0.208 and weighted average of 65.6%, a difference of 0.92%.
In Labor Force | Age > 16 Correlation Summary
| Measurement | Immigrants from Greece | Costa Rican |
| Minimum | 25.8% | 40.9% |
| Maximum | 89.9% | 89.9% |
| Range | 64.1% | 49.0% |
| Mean | 61.8% | 64.5% |
| Median | 63.8% | 65.3% |
| Interquartile 25% (IQ1) | 57.6% | 60.2% |
| Interquartile 75% (IQ3) | 66.2% | 69.4% |
| Interquartile Range (IQR) | 8.6% | 9.2% |
| Standard Deviation (Sample) | 9.2% | 8.5% |
| Standard Deviation (Population) | 9.2% | 8.5% |
Similar Demographics by In Labor Force | Age > 16
Demographics Similar to Immigrants from Greece by In Labor Force | Age > 16
In terms of in labor force | age > 16, the demographic groups most similar to Immigrants from Greece are Barbadian (65.0%, a difference of 0.0%), Immigrants from Portugal (65.0%, a difference of 0.010%), Scandinavian (65.0%, a difference of 0.010%), Immigrants from Fiji (65.0%, a difference of 0.010%), and Immigrants from Europe (65.0%, a difference of 0.010%).
| Demographics | Rating | Rank | In Labor Force | Age > 16 |
| Immigrants | Nicaragua | 41.1 /100 | #182 | Average 65.1% |
| Soviet Union | 40.5 /100 | #183 | Average 65.0% |
| Carpatho Rusyns | 40.0 /100 | #184 | Average 65.0% |
| Syrians | 40.0 /100 | #185 | Average 65.0% |
| Immigrants | Switzerland | 38.2 /100 | #186 | Fair 65.0% |
| Immigrants | Croatia | 35.7 /100 | #187 | Fair 65.0% |
| Immigrants | Portugal | 34.8 /100 | #188 | Fair 65.0% |
| Immigrants | Greece | 34.3 /100 | #189 | Fair 65.0% |
| Barbadians | 33.9 /100 | #190 | Fair 65.0% |
| Scandinavians | 33.7 /100 | #191 | Fair 65.0% |
| Immigrants | Fiji | 33.7 /100 | #192 | Fair 65.0% |
| Immigrants | Europe | 33.6 /100 | #193 | Fair 65.0% |
| Immigrants | Southern Europe | 31.3 /100 | #194 | Fair 65.0% |
| Romanians | 31.1 /100 | #195 | Fair 65.0% |
| Haitians | 30.6 /100 | #196 | Fair 65.0% |
Demographics Similar to Costa Ricans by In Labor Force | Age > 16
In terms of in labor force | age > 16, the demographic groups most similar to Costa Ricans are Immigrants from Lithuania (65.6%, a difference of 0.010%), Guatemalan (65.6%, a difference of 0.030%), Immigrants from Argentina (65.6%, a difference of 0.030%), Immigrants from North Macedonia (65.6%, a difference of 0.040%), and Guamanian/Chamorro (65.6%, a difference of 0.040%).
| Demographics | Rating | Rank | In Labor Force | Age > 16 |
| Immigrants | Eastern Asia | 94.9 /100 | #127 | Exceptional 65.7% |
| Ecuadorians | 94.7 /100 | #128 | Exceptional 65.6% |
| Immigrants | Philippines | 94.5 /100 | #129 | Exceptional 65.6% |
| Immigrants | Guatemala | 94.4 /100 | #130 | Exceptional 65.6% |
| Icelanders | 94.3 /100 | #131 | Exceptional 65.6% |
| Immigrants | North Macedonia | 94.1 /100 | #132 | Exceptional 65.6% |
| Immigrants | Lithuania | 93.5 /100 | #133 | Exceptional 65.6% |
| Costa Ricans | 93.2 /100 | #134 | Exceptional 65.6% |
| Guatemalans | 92.5 /100 | #135 | Exceptional 65.6% |
| Immigrants | Argentina | 92.4 /100 | #136 | Exceptional 65.6% |
| Guamanians/Chamorros | 92.4 /100 | #137 | Exceptional 65.6% |
| Immigrants | West Indies | 92.0 /100 | #138 | Exceptional 65.6% |
| Immigrants | Taiwan | 90.8 /100 | #139 | Exceptional 65.5% |
| Immigrants | Costa Rica | 90.8 /100 | #140 | Exceptional 65.5% |
| Samoans | 90.5 /100 | #141 | Exceptional 65.5% |