Barbadian vs Immigrants from Kazakhstan Doctorate Degree
COMPARE
Barbadian
Immigrants from Kazakhstan
Doctorate Degree
Doctorate Degree Comparison
Barbadians
Immigrants from Kazakhstan
1.6%
DOCTORATE DEGREE
3.3/ 100
METRIC RATING
233rd/ 347
METRIC RANK
2.3%
DOCTORATE DEGREE
99.8/ 100
METRIC RATING
68th/ 347
METRIC RANK
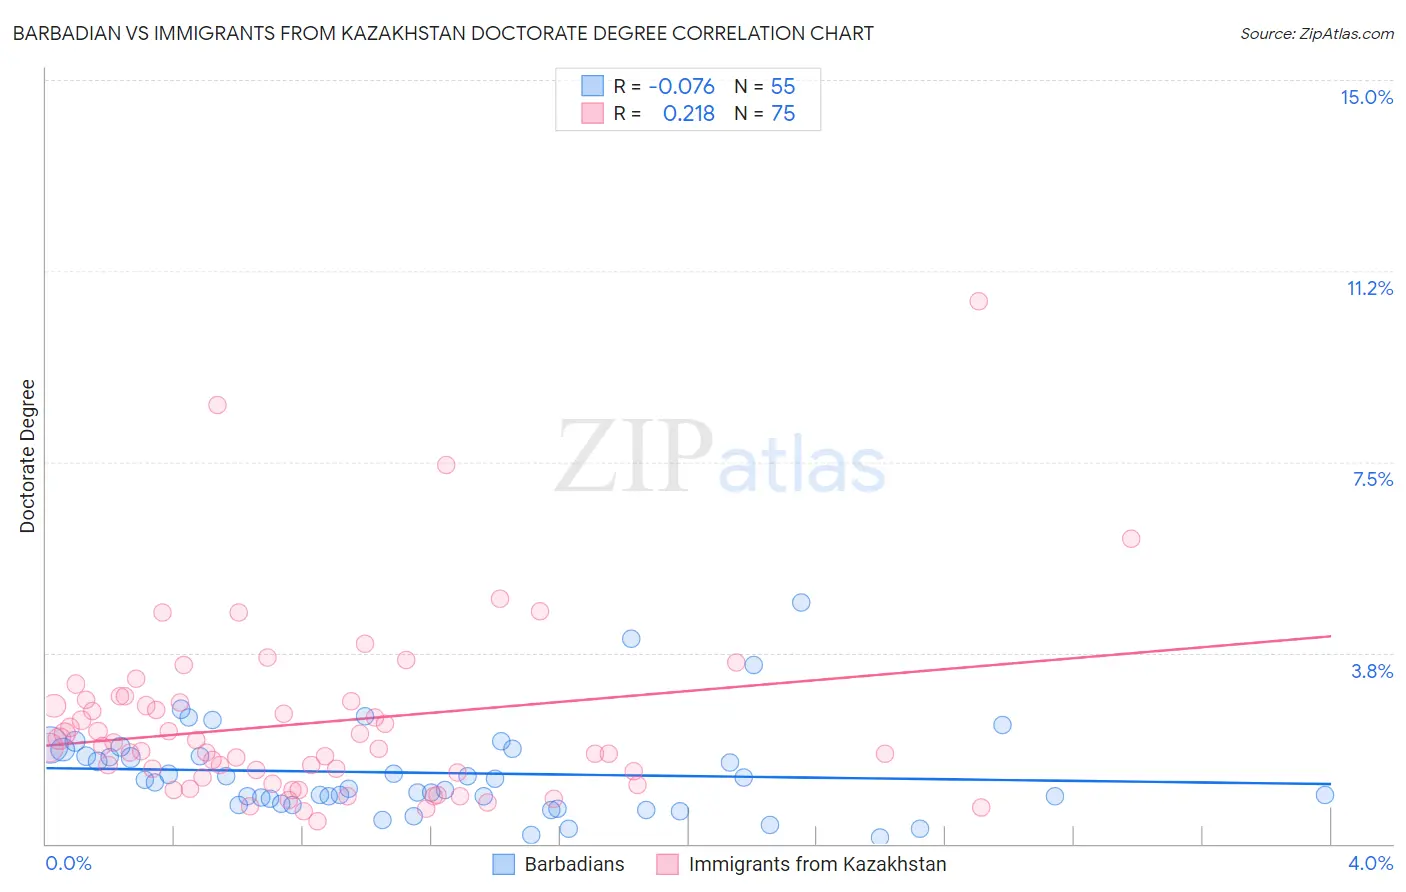
Barbadian vs Immigrants from Kazakhstan Doctorate Degree Correlation Chart
The statistical analysis conducted on geographies consisting of 140,930,059 people shows a slight negative correlation between the proportion of Barbadians and percentage of population with at least doctorate degree education in the United States with a correlation coefficient (R) of -0.076 and weighted average of 1.6%. Similarly, the statistical analysis conducted on geographies consisting of 124,281,798 people shows a weak positive correlation between the proportion of Immigrants from Kazakhstan and percentage of population with at least doctorate degree education in the United States with a correlation coefficient (R) of 0.218 and weighted average of 2.3%, a difference of 40.8%.
Doctorate Degree Correlation Summary
| Measurement | Barbadian | Immigrants from Kazakhstan |
| Minimum | 0.13% | 0.44% |
| Maximum | 4.7% | 10.6% |
| Range | 4.6% | 10.2% |
| Mean | 1.4% | 2.4% |
| Median | 1.2% | 1.9% |
| Interquartile 25% (IQ1) | 0.80% | 1.3% |
| Interquartile 75% (IQ3) | 1.8% | 2.8% |
| Interquartile Range (IQR) | 1.1% | 1.5% |
| Standard Deviation (Sample) | 0.91% | 1.8% |
| Standard Deviation (Population) | 0.90% | 1.8% |
Similar Demographics by Doctorate Degree
Demographics Similar to Barbadians by Doctorate Degree
In terms of doctorate degree, the demographic groups most similar to Barbadians are Guamanian/Chamorro (1.6%, a difference of 0.070%), Hopi (1.6%, a difference of 0.15%), Cree (1.6%, a difference of 0.36%), Indonesian (1.6%, a difference of 0.64%), and Immigrants from North Macedonia (1.6%, a difference of 0.76%).
| Demographics | Rating | Rank | Doctorate Degree |
| Osage | 6.5 /100 | #226 | Tragic 1.7% |
| Panamanians | 6.3 /100 | #227 | Tragic 1.7% |
| Assyrians/Chaldeans/Syriacs | 5.9 /100 | #228 | Tragic 1.7% |
| Colville | 4.7 /100 | #229 | Tragic 1.6% |
| Immigrants | Philippines | 4.3 /100 | #230 | Tragic 1.6% |
| Immigrants | North Macedonia | 3.9 /100 | #231 | Tragic 1.6% |
| Guamanians/Chamorros | 3.3 /100 | #232 | Tragic 1.6% |
| Barbadians | 3.3 /100 | #233 | Tragic 1.6% |
| Hopi | 3.2 /100 | #234 | Tragic 1.6% |
| Cree | 3.0 /100 | #235 | Tragic 1.6% |
| Indonesians | 2.8 /100 | #236 | Tragic 1.6% |
| Iroquois | 2.7 /100 | #237 | Tragic 1.6% |
| Immigrants | Congo | 2.6 /100 | #238 | Tragic 1.6% |
| West Indians | 2.5 /100 | #239 | Tragic 1.6% |
| Immigrants | Panama | 2.4 /100 | #240 | Tragic 1.6% |
Demographics Similar to Immigrants from Kazakhstan by Doctorate Degree
In terms of doctorate degree, the demographic groups most similar to Immigrants from Kazakhstan are Zimbabwean (2.3%, a difference of 0.23%), Carpatho Rusyn (2.3%, a difference of 0.25%), Lithuanian (2.3%, a difference of 0.39%), Immigrants from Bolivia (2.3%, a difference of 0.39%), and Immigrants from Canada (2.3%, a difference of 0.55%).
| Demographics | Rating | Rank | Doctorate Degree |
| Bhutanese | 99.9 /100 | #61 | Exceptional 2.3% |
| Immigrants | Europe | 99.9 /100 | #62 | Exceptional 2.3% |
| Laotians | 99.9 /100 | #63 | Exceptional 2.3% |
| Immigrants | Greece | 99.9 /100 | #64 | Exceptional 2.3% |
| Paraguayans | 99.9 /100 | #65 | Exceptional 2.3% |
| Argentineans | 99.9 /100 | #66 | Exceptional 2.3% |
| Zimbabweans | 99.8 /100 | #67 | Exceptional 2.3% |
| Immigrants | Kazakhstan | 99.8 /100 | #68 | Exceptional 2.3% |
| Carpatho Rusyns | 99.8 /100 | #69 | Exceptional 2.3% |
| Lithuanians | 99.8 /100 | #70 | Exceptional 2.3% |
| Immigrants | Bolivia | 99.8 /100 | #71 | Exceptional 2.3% |
| Immigrants | Canada | 99.8 /100 | #72 | Exceptional 2.3% |
| Immigrants | Bulgaria | 99.8 /100 | #73 | Exceptional 2.3% |
| Immigrants | North America | 99.8 /100 | #74 | Exceptional 2.2% |
| Immigrants | Western Asia | 99.8 /100 | #75 | Exceptional 2.2% |