Barbadian vs Immigrants from Nepal In Labor Force | Age 20-24
COMPARE
Barbadian
Immigrants from Nepal
In Labor Force | Age 20-24
In Labor Force | Age 20-24 Comparison
Barbadians
Immigrants from Nepal
71.1%
IN LABOR FORCE | AGE 20-24
0.0/ 100
METRIC RATING
325th/ 347
METRIC RANK
76.0%
IN LABOR FORCE | AGE 20-24
97.2/ 100
METRIC RATING
105th/ 347
METRIC RANK
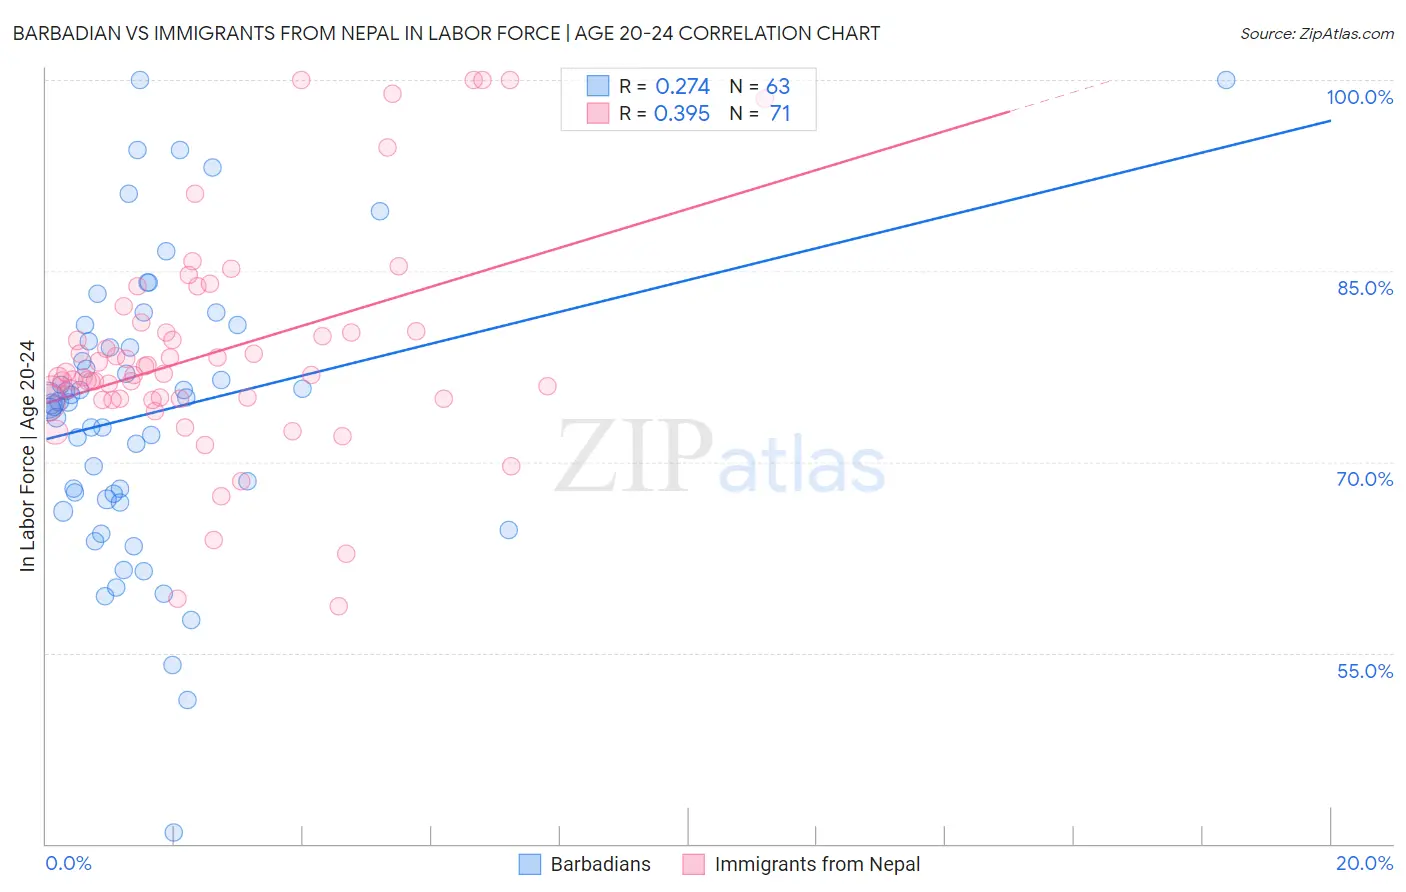
Barbadian vs Immigrants from Nepal In Labor Force | Age 20-24 Correlation Chart
The statistical analysis conducted on geographies consisting of 141,301,120 people shows a weak positive correlation between the proportion of Barbadians and labor force participation rate among population between the ages 20 and 24 in the United States with a correlation coefficient (R) of 0.274 and weighted average of 71.1%. Similarly, the statistical analysis conducted on geographies consisting of 186,788,747 people shows a mild positive correlation between the proportion of Immigrants from Nepal and labor force participation rate among population between the ages 20 and 24 in the United States with a correlation coefficient (R) of 0.395 and weighted average of 76.0%, a difference of 6.9%.
In Labor Force | Age 20-24 Correlation Summary
| Measurement | Barbadian | Immigrants from Nepal |
| Minimum | 40.9% | 58.7% |
| Maximum | 100.0% | 100.0% |
| Range | 59.1% | 41.3% |
| Mean | 73.9% | 78.6% |
| Median | 74.7% | 76.8% |
| Interquartile 25% (IQ1) | 67.1% | 74.9% |
| Interquartile 75% (IQ3) | 79.5% | 80.3% |
| Interquartile Range (IQR) | 12.5% | 5.4% |
| Standard Deviation (Sample) | 11.3% | 8.7% |
| Standard Deviation (Population) | 11.2% | 8.7% |
Similar Demographics by In Labor Force | Age 20-24
Demographics Similar to Barbadians by In Labor Force | Age 20-24
In terms of in labor force | age 20-24, the demographic groups most similar to Barbadians are Dominican (71.1%, a difference of 0.080%), Immigrants from Trinidad and Tobago (71.1%, a difference of 0.090%), Immigrants from China (71.1%, a difference of 0.10%), Immigrants from Dominican Republic (71.2%, a difference of 0.11%), and West Indian (71.3%, a difference of 0.20%).
| Demographics | Rating | Rank | In Labor Force | Age 20-24 |
| Immigrants | Hong Kong | 0.0 /100 | #318 | Tragic 71.6% |
| Immigrants | Israel | 0.0 /100 | #319 | Tragic 71.6% |
| Trinidadians and Tobagonians | 0.0 /100 | #320 | Tragic 71.5% |
| Immigrants | Taiwan | 0.0 /100 | #321 | Tragic 71.5% |
| Filipinos | 0.0 /100 | #322 | Tragic 71.4% |
| West Indians | 0.0 /100 | #323 | Tragic 71.3% |
| Immigrants | Dominican Republic | 0.0 /100 | #324 | Tragic 71.2% |
| Barbadians | 0.0 /100 | #325 | Tragic 71.1% |
| Dominicans | 0.0 /100 | #326 | Tragic 71.1% |
| Immigrants | Trinidad and Tobago | 0.0 /100 | #327 | Tragic 71.1% |
| Immigrants | China | 0.0 /100 | #328 | Tragic 71.1% |
| Yup'ik | 0.0 /100 | #329 | Tragic 70.9% |
| Vietnamese | 0.0 /100 | #330 | Tragic 70.6% |
| Immigrants | Bangladesh | 0.0 /100 | #331 | Tragic 70.6% |
| Immigrants | Uzbekistan | 0.0 /100 | #332 | Tragic 70.4% |
Demographics Similar to Immigrants from Nepal by In Labor Force | Age 20-24
In terms of in labor force | age 20-24, the demographic groups most similar to Immigrants from Nepal are Macedonian (76.0%, a difference of 0.0%), Immigrants from Uganda (76.0%, a difference of 0.010%), Immigrants from North Macedonia (76.1%, a difference of 0.040%), Greek (76.0%, a difference of 0.040%), and Latvian (76.1%, a difference of 0.060%).
| Demographics | Rating | Rank | In Labor Force | Age 20-24 |
| Immigrants | Oceania | 98.0 /100 | #98 | Exceptional 76.1% |
| Americans | 97.8 /100 | #99 | Exceptional 76.1% |
| Shoshone | 97.8 /100 | #100 | Exceptional 76.1% |
| Immigrants | Poland | 97.7 /100 | #101 | Exceptional 76.1% |
| Latvians | 97.6 /100 | #102 | Exceptional 76.1% |
| Immigrants | North Macedonia | 97.5 /100 | #103 | Exceptional 76.1% |
| Macedonians | 97.2 /100 | #104 | Exceptional 76.0% |
| Immigrants | Nepal | 97.2 /100 | #105 | Exceptional 76.0% |
| Immigrants | Uganda | 97.1 /100 | #106 | Exceptional 76.0% |
| Greeks | 96.9 /100 | #107 | Exceptional 76.0% |
| Iraqis | 96.6 /100 | #108 | Exceptional 76.0% |
| Cherokee | 95.8 /100 | #109 | Exceptional 75.9% |
| Immigrants | Morocco | 95.8 /100 | #110 | Exceptional 75.9% |
| Ukrainians | 95.7 /100 | #111 | Exceptional 75.9% |
| Immigrants | Canada | 95.6 /100 | #112 | Exceptional 75.9% |