Barbadian vs Uruguayan In Labor Force | Age 20-24
COMPARE
Barbadian
Uruguayan
In Labor Force | Age 20-24
In Labor Force | Age 20-24 Comparison
Barbadians
Uruguayans
71.1%
IN LABOR FORCE | AGE 20-24
0.0/ 100
METRIC RATING
325th/ 347
METRIC RANK
74.6%
IN LABOR FORCE | AGE 20-24
15.1/ 100
METRIC RATING
210th/ 347
METRIC RANK
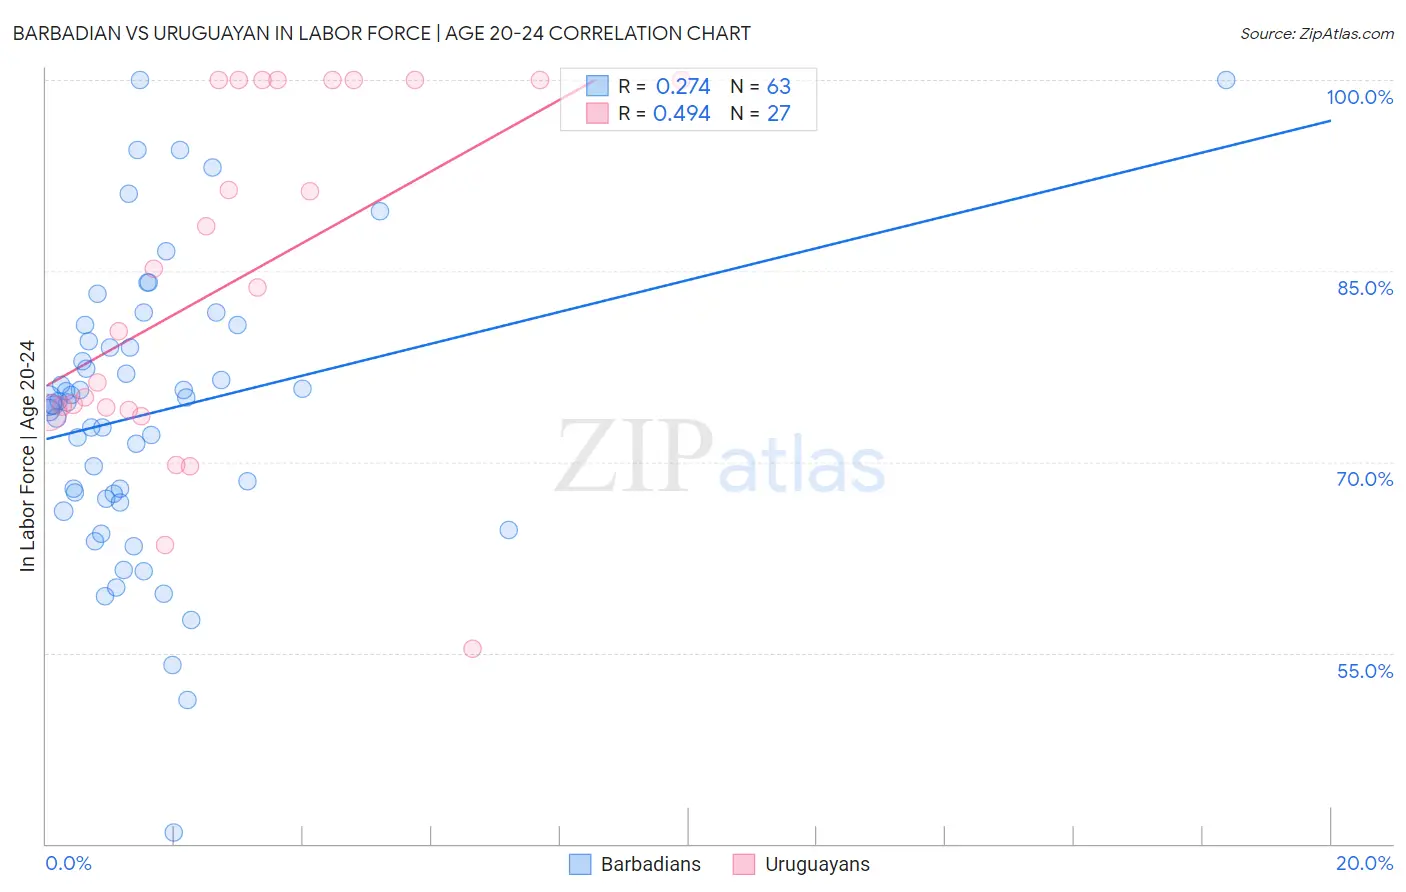
Barbadian vs Uruguayan In Labor Force | Age 20-24 Correlation Chart
The statistical analysis conducted on geographies consisting of 141,301,120 people shows a weak positive correlation between the proportion of Barbadians and labor force participation rate among population between the ages 20 and 24 in the United States with a correlation coefficient (R) of 0.274 and weighted average of 71.1%. Similarly, the statistical analysis conducted on geographies consisting of 144,780,215 people shows a moderate positive correlation between the proportion of Uruguayans and labor force participation rate among population between the ages 20 and 24 in the United States with a correlation coefficient (R) of 0.494 and weighted average of 74.6%, a difference of 4.8%.
In Labor Force | Age 20-24 Correlation Summary
| Measurement | Barbadian | Uruguayan |
| Minimum | 40.9% | 55.3% |
| Maximum | 100.0% | 100.0% |
| Range | 59.1% | 44.7% |
| Mean | 73.9% | 84.2% |
| Median | 74.7% | 83.7% |
| Interquartile 25% (IQ1) | 67.1% | 74.0% |
| Interquartile 75% (IQ3) | 79.5% | 100.0% |
| Interquartile Range (IQR) | 12.5% | 26.0% |
| Standard Deviation (Sample) | 11.3% | 13.6% |
| Standard Deviation (Population) | 11.2% | 13.4% |
Similar Demographics by In Labor Force | Age 20-24
Demographics Similar to Barbadians by In Labor Force | Age 20-24
In terms of in labor force | age 20-24, the demographic groups most similar to Barbadians are Dominican (71.1%, a difference of 0.080%), Immigrants from Trinidad and Tobago (71.1%, a difference of 0.090%), Immigrants from China (71.1%, a difference of 0.10%), Immigrants from Dominican Republic (71.2%, a difference of 0.11%), and West Indian (71.3%, a difference of 0.20%).
| Demographics | Rating | Rank | In Labor Force | Age 20-24 |
| Immigrants | Hong Kong | 0.0 /100 | #318 | Tragic 71.6% |
| Immigrants | Israel | 0.0 /100 | #319 | Tragic 71.6% |
| Trinidadians and Tobagonians | 0.0 /100 | #320 | Tragic 71.5% |
| Immigrants | Taiwan | 0.0 /100 | #321 | Tragic 71.5% |
| Filipinos | 0.0 /100 | #322 | Tragic 71.4% |
| West Indians | 0.0 /100 | #323 | Tragic 71.3% |
| Immigrants | Dominican Republic | 0.0 /100 | #324 | Tragic 71.2% |
| Barbadians | 0.0 /100 | #325 | Tragic 71.1% |
| Dominicans | 0.0 /100 | #326 | Tragic 71.1% |
| Immigrants | Trinidad and Tobago | 0.0 /100 | #327 | Tragic 71.1% |
| Immigrants | China | 0.0 /100 | #328 | Tragic 71.1% |
| Yup'ik | 0.0 /100 | #329 | Tragic 70.9% |
| Vietnamese | 0.0 /100 | #330 | Tragic 70.6% |
| Immigrants | Bangladesh | 0.0 /100 | #331 | Tragic 70.6% |
| Immigrants | Uzbekistan | 0.0 /100 | #332 | Tragic 70.4% |
Demographics Similar to Uruguayans by In Labor Force | Age 20-24
In terms of in labor force | age 20-24, the demographic groups most similar to Uruguayans are Immigrants from Australia (74.6%, a difference of 0.010%), Immigrants from Uruguay (74.6%, a difference of 0.020%), Arab (74.6%, a difference of 0.020%), Albanian (74.6%, a difference of 0.030%), and Creek (74.5%, a difference of 0.050%).
| Demographics | Rating | Rank | In Labor Force | Age 20-24 |
| Immigrants | Northern Africa | 17.9 /100 | #203 | Poor 74.6% |
| Immigrants | Italy | 17.6 /100 | #204 | Poor 74.6% |
| Inupiat | 17.6 /100 | #205 | Poor 74.6% |
| Sioux | 17.5 /100 | #206 | Poor 74.6% |
| Albanians | 16.2 /100 | #207 | Poor 74.6% |
| Immigrants | Uruguay | 15.8 /100 | #208 | Poor 74.6% |
| Arabs | 15.8 /100 | #209 | Poor 74.6% |
| Uruguayans | 15.1 /100 | #210 | Poor 74.6% |
| Immigrants | Australia | 14.7 /100 | #211 | Poor 74.6% |
| Creek | 13.3 /100 | #212 | Poor 74.5% |
| Peruvians | 13.3 /100 | #213 | Poor 74.5% |
| Immigrants | Southern Europe | 13.2 /100 | #214 | Poor 74.5% |
| Immigrants | Ghana | 12.7 /100 | #215 | Poor 74.5% |
| Immigrants | Kuwait | 12.7 /100 | #216 | Poor 74.5% |
| Chileans | 12.5 /100 | #217 | Poor 74.5% |