Barbadian vs Immigrants from Portugal In Labor Force | Age 20-24
COMPARE
Barbadian
Immigrants from Portugal
In Labor Force | Age 20-24
In Labor Force | Age 20-24 Comparison
Barbadians
Immigrants from Portugal
71.1%
IN LABOR FORCE | AGE 20-24
0.0/ 100
METRIC RATING
325th/ 347
METRIC RANK
75.8%
IN LABOR FORCE | AGE 20-24
94.8/ 100
METRIC RATING
119th/ 347
METRIC RANK
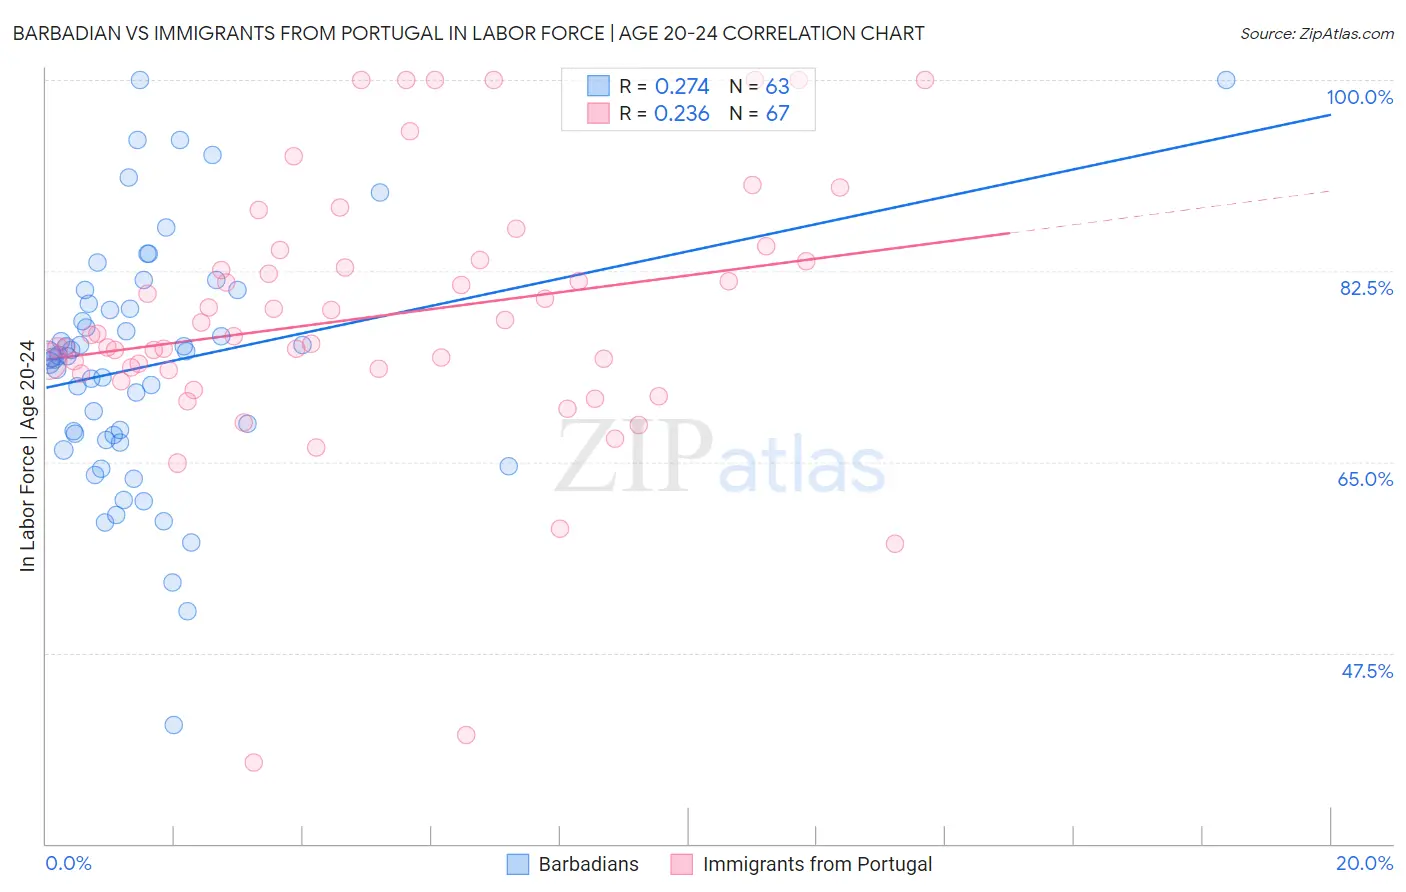
Barbadian vs Immigrants from Portugal In Labor Force | Age 20-24 Correlation Chart
The statistical analysis conducted on geographies consisting of 141,301,120 people shows a weak positive correlation between the proportion of Barbadians and labor force participation rate among population between the ages 20 and 24 in the United States with a correlation coefficient (R) of 0.274 and weighted average of 71.1%. Similarly, the statistical analysis conducted on geographies consisting of 174,703,744 people shows a weak positive correlation between the proportion of Immigrants from Portugal and labor force participation rate among population between the ages 20 and 24 in the United States with a correlation coefficient (R) of 0.236 and weighted average of 75.8%, a difference of 6.6%.
In Labor Force | Age 20-24 Correlation Summary
| Measurement | Barbadian | Immigrants from Portugal |
| Minimum | 40.9% | 37.5% |
| Maximum | 100.0% | 100.0% |
| Range | 59.1% | 62.5% |
| Mean | 73.9% | 78.3% |
| Median | 74.7% | 76.6% |
| Interquartile 25% (IQ1) | 67.1% | 73.5% |
| Interquartile 75% (IQ3) | 79.5% | 83.6% |
| Interquartile Range (IQR) | 12.5% | 10.1% |
| Standard Deviation (Sample) | 11.3% | 12.1% |
| Standard Deviation (Population) | 11.2% | 12.1% |
Similar Demographics by In Labor Force | Age 20-24
Demographics Similar to Barbadians by In Labor Force | Age 20-24
In terms of in labor force | age 20-24, the demographic groups most similar to Barbadians are Dominican (71.1%, a difference of 0.080%), Immigrants from Trinidad and Tobago (71.1%, a difference of 0.090%), Immigrants from China (71.1%, a difference of 0.10%), Immigrants from Dominican Republic (71.2%, a difference of 0.11%), and West Indian (71.3%, a difference of 0.20%).
| Demographics | Rating | Rank | In Labor Force | Age 20-24 |
| Immigrants | Hong Kong | 0.0 /100 | #318 | Tragic 71.6% |
| Immigrants | Israel | 0.0 /100 | #319 | Tragic 71.6% |
| Trinidadians and Tobagonians | 0.0 /100 | #320 | Tragic 71.5% |
| Immigrants | Taiwan | 0.0 /100 | #321 | Tragic 71.5% |
| Filipinos | 0.0 /100 | #322 | Tragic 71.4% |
| West Indians | 0.0 /100 | #323 | Tragic 71.3% |
| Immigrants | Dominican Republic | 0.0 /100 | #324 | Tragic 71.2% |
| Barbadians | 0.0 /100 | #325 | Tragic 71.1% |
| Dominicans | 0.0 /100 | #326 | Tragic 71.1% |
| Immigrants | Trinidad and Tobago | 0.0 /100 | #327 | Tragic 71.1% |
| Immigrants | China | 0.0 /100 | #328 | Tragic 71.1% |
| Yup'ik | 0.0 /100 | #329 | Tragic 70.9% |
| Vietnamese | 0.0 /100 | #330 | Tragic 70.6% |
| Immigrants | Bangladesh | 0.0 /100 | #331 | Tragic 70.6% |
| Immigrants | Uzbekistan | 0.0 /100 | #332 | Tragic 70.4% |
Demographics Similar to Immigrants from Portugal by In Labor Force | Age 20-24
In terms of in labor force | age 20-24, the demographic groups most similar to Immigrants from Portugal are Spanish American (75.8%, a difference of 0.0%), Immigrants from North America (75.9%, a difference of 0.010%), Assyrian/Chaldean/Syriac (75.9%, a difference of 0.010%), Immigrants from Africa (75.8%, a difference of 0.010%), and Immigrants from Zimbabwe (75.9%, a difference of 0.020%).
| Demographics | Rating | Rank | In Labor Force | Age 20-24 |
| Immigrants | Canada | 95.6 /100 | #112 | Exceptional 75.9% |
| Immigrants | Netherlands | 95.3 /100 | #113 | Exceptional 75.9% |
| Immigrants | Zimbabwe | 95.1 /100 | #114 | Exceptional 75.9% |
| Alaska Natives | 95.1 /100 | #115 | Exceptional 75.9% |
| Immigrants | North America | 95.0 /100 | #116 | Exceptional 75.9% |
| Assyrians/Chaldeans/Syriacs | 94.9 /100 | #117 | Exceptional 75.9% |
| Spanish Americans | 94.8 /100 | #118 | Exceptional 75.8% |
| Immigrants | Portugal | 94.8 /100 | #119 | Exceptional 75.8% |
| Immigrants | Africa | 94.6 /100 | #120 | Exceptional 75.8% |
| Immigrants | Serbia | 94.3 /100 | #121 | Exceptional 75.8% |
| Pakistanis | 94.1 /100 | #122 | Exceptional 75.8% |
| Immigrants | Bulgaria | 94.1 /100 | #123 | Exceptional 75.8% |
| Immigrants | Sierra Leone | 93.8 /100 | #124 | Exceptional 75.8% |
| Immigrants | Scotland | 93.7 /100 | #125 | Exceptional 75.8% |
| Brazilians | 93.0 /100 | #126 | Exceptional 75.8% |