Hispanic or Latino vs Yuman In Labor Force | Age 20-24
COMPARE
Hispanic or Latino
Yuman
In Labor Force | Age 20-24
In Labor Force | Age 20-24 Comparison
Hispanics or Latinos
Yuman
74.4%
IN LABOR FORCE | AGE 20-24
7.9/ 100
METRIC RATING
223rd/ 347
METRIC RANK
70.3%
IN LABOR FORCE | AGE 20-24
0.0/ 100
METRIC RATING
333rd/ 347
METRIC RANK
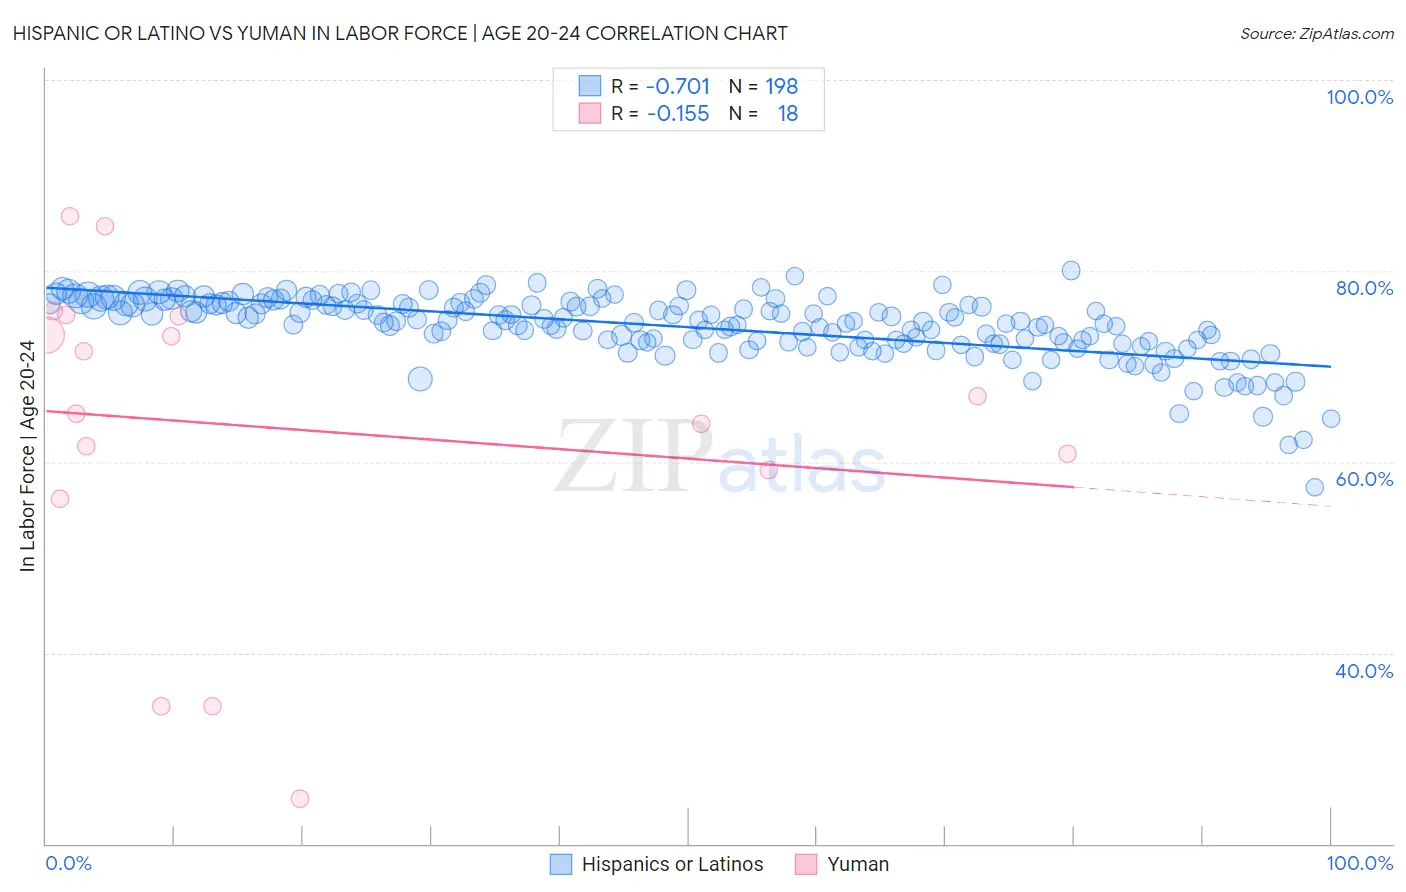
Hispanic or Latino vs Yuman In Labor Force | Age 20-24 Correlation Chart
The statistical analysis conducted on geographies consisting of 573,599,041 people shows a strong negative correlation between the proportion of Hispanics or Latinos and labor force participation rate among population between the ages 20 and 24 in the United States with a correlation coefficient (R) of -0.701 and weighted average of 74.4%. Similarly, the statistical analysis conducted on geographies consisting of 40,677,141 people shows a poor negative correlation between the proportion of Yuman and labor force participation rate among population between the ages 20 and 24 in the United States with a correlation coefficient (R) of -0.155 and weighted average of 70.3%, a difference of 5.9%.
In Labor Force | Age 20-24 Correlation Summary
| Measurement | Hispanic or Latino | Yuman |
| Minimum | 57.4% | 24.7% |
| Maximum | 80.0% | 85.7% |
| Range | 22.7% | 61.0% |
| Mean | 74.1% | 63.4% |
| Median | 74.8% | 66.0% |
| Interquartile 25% (IQ1) | 72.6% | 59.1% |
| Interquartile 75% (IQ3) | 76.6% | 75.2% |
| Interquartile Range (IQR) | 4.0% | 16.1% |
| Standard Deviation (Sample) | 3.4% | 17.0% |
| Standard Deviation (Population) | 3.4% | 16.5% |
Similar Demographics by In Labor Force | Age 20-24
Demographics Similar to Hispanics or Latinos by In Labor Force | Age 20-24
In terms of in labor force | age 20-24, the demographic groups most similar to Hispanics or Latinos are Seminole (74.3%, a difference of 0.060%), Immigrants from India (74.4%, a difference of 0.090%), Chickasaw (74.5%, a difference of 0.10%), Ghanaian (74.3%, a difference of 0.10%), and Immigrants from Norway (74.5%, a difference of 0.11%).
| Demographics | Rating | Rank | In Labor Force | Age 20-24 |
| Immigrants | Kuwait | 12.7 /100 | #216 | Poor 74.5% |
| Chileans | 12.5 /100 | #217 | Poor 74.5% |
| Immigrants | Peru | 10.6 /100 | #218 | Poor 74.5% |
| Nepalese | 10.5 /100 | #219 | Poor 74.5% |
| Immigrants | Norway | 10.3 /100 | #220 | Poor 74.5% |
| Chickasaw | 10.3 /100 | #221 | Poor 74.5% |
| Immigrants | India | 9.9 /100 | #222 | Tragic 74.4% |
| Hispanics or Latinos | 7.9 /100 | #223 | Tragic 74.4% |
| Seminole | 6.9 /100 | #224 | Tragic 74.3% |
| Ghanaians | 6.2 /100 | #225 | Tragic 74.3% |
| Immigrants | Fiji | 5.9 /100 | #226 | Tragic 74.3% |
| Immigrants | Ireland | 5.8 /100 | #227 | Tragic 74.3% |
| Immigrants | Ukraine | 5.1 /100 | #228 | Tragic 74.2% |
| Immigrants | Sweden | 4.6 /100 | #229 | Tragic 74.2% |
| Immigrants | Albania | 4.3 /100 | #230 | Tragic 74.2% |
Demographics Similar to Yuman by In Labor Force | Age 20-24
In terms of in labor force | age 20-24, the demographic groups most similar to Yuman are Immigrants from Uzbekistan (70.4%, a difference of 0.23%), British West Indian (70.0%, a difference of 0.41%), Immigrants from Bangladesh (70.6%, a difference of 0.53%), Vietnamese (70.6%, a difference of 0.55%), and Immigrants from Barbados (69.7%, a difference of 0.75%).
| Demographics | Rating | Rank | In Labor Force | Age 20-24 |
| Dominicans | 0.0 /100 | #326 | Tragic 71.1% |
| Immigrants | Trinidad and Tobago | 0.0 /100 | #327 | Tragic 71.1% |
| Immigrants | China | 0.0 /100 | #328 | Tragic 71.1% |
| Yup'ik | 0.0 /100 | #329 | Tragic 70.9% |
| Vietnamese | 0.0 /100 | #330 | Tragic 70.6% |
| Immigrants | Bangladesh | 0.0 /100 | #331 | Tragic 70.6% |
| Immigrants | Uzbekistan | 0.0 /100 | #332 | Tragic 70.4% |
| Yuman | 0.0 /100 | #333 | Tragic 70.3% |
| British West Indians | 0.0 /100 | #334 | Tragic 70.0% |
| Immigrants | Barbados | 0.0 /100 | #335 | Tragic 69.7% |
| Immigrants | Guyana | 0.0 /100 | #336 | Tragic 69.3% |
| Guyanese | 0.0 /100 | #337 | Tragic 69.2% |
| Pima | 0.0 /100 | #338 | Tragic 69.0% |
| Immigrants | Yemen | 0.0 /100 | #339 | Tragic 68.9% |
| Menominee | 0.0 /100 | #340 | Tragic 68.7% |