Nonimmigrants vs Yuman In Labor Force | Age 20-24
COMPARE
Nonimmigrants
Yuman
In Labor Force | Age 20-24
In Labor Force | Age 20-24 Comparison
Nonimmigrants
Yuman
76.2%
IN LABOR FORCE | AGE 20-24
98.5/ 100
METRIC RATING
96th/ 347
METRIC RANK
70.3%
IN LABOR FORCE | AGE 20-24
0.0/ 100
METRIC RATING
333rd/ 347
METRIC RANK
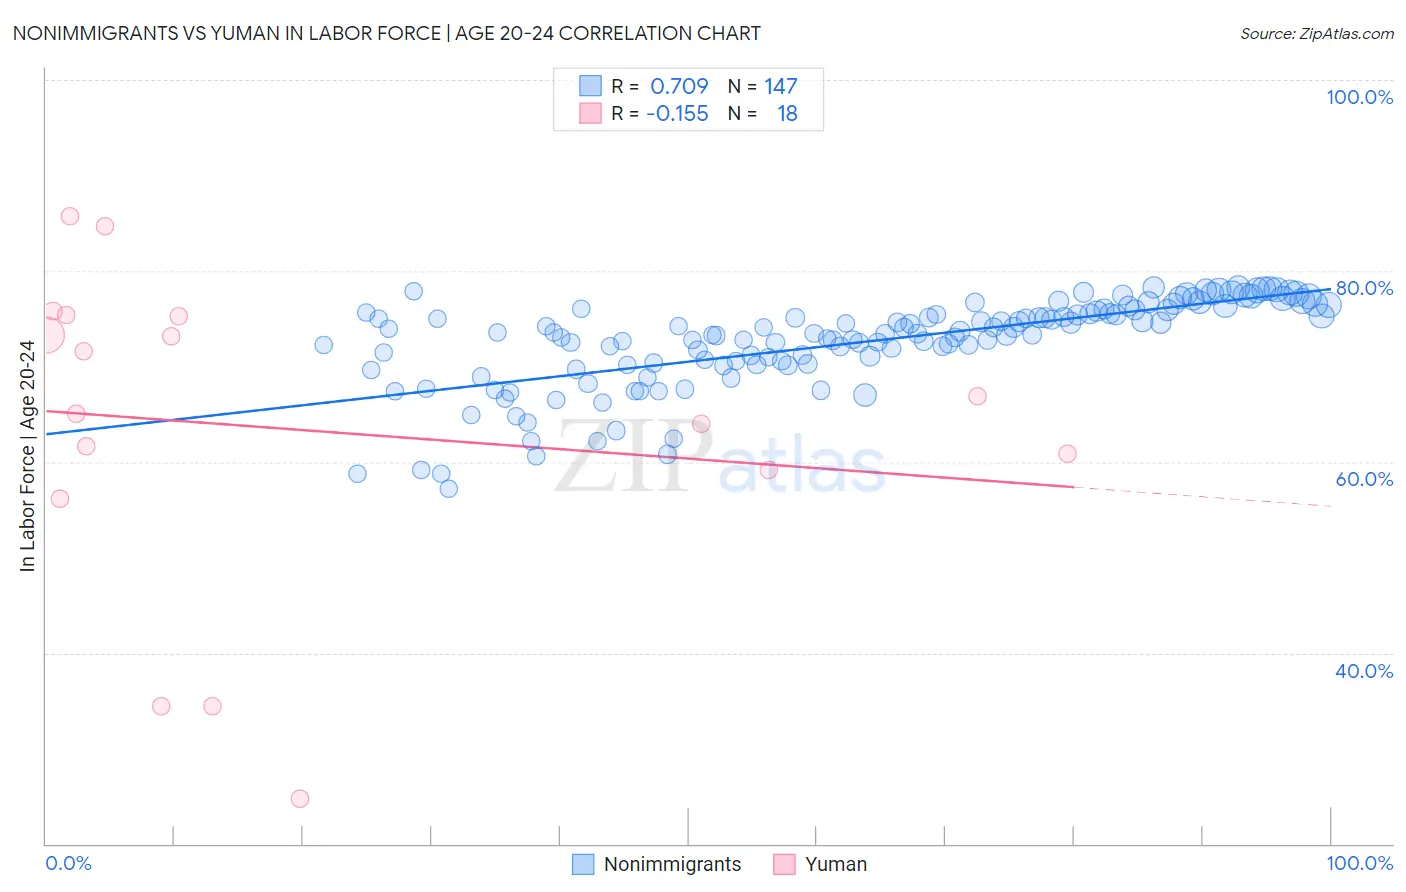
Nonimmigrants vs Yuman In Labor Force | Age 20-24 Correlation Chart
The statistical analysis conducted on geographies consisting of 582,321,268 people shows a strong positive correlation between the proportion of Nonimmigrants and labor force participation rate among population between the ages 20 and 24 in the United States with a correlation coefficient (R) of 0.709 and weighted average of 76.2%. Similarly, the statistical analysis conducted on geographies consisting of 40,677,141 people shows a poor negative correlation between the proportion of Yuman and labor force participation rate among population between the ages 20 and 24 in the United States with a correlation coefficient (R) of -0.155 and weighted average of 70.3%, a difference of 8.5%.
In Labor Force | Age 20-24 Correlation Summary
| Measurement | Nonimmigrants | Yuman |
| Minimum | 57.2% | 24.7% |
| Maximum | 78.3% | 85.7% |
| Range | 21.1% | 61.0% |
| Mean | 72.5% | 63.4% |
| Median | 73.4% | 66.0% |
| Interquartile 25% (IQ1) | 70.2% | 59.1% |
| Interquartile 75% (IQ3) | 75.8% | 75.2% |
| Interquartile Range (IQR) | 5.6% | 16.1% |
| Standard Deviation (Sample) | 4.7% | 17.0% |
| Standard Deviation (Population) | 4.6% | 16.5% |
Similar Demographics by In Labor Force | Age 20-24
Demographics Similar to Nonimmigrants by In Labor Force | Age 20-24
In terms of in labor force | age 20-24, the demographic groups most similar to Nonimmigrants are Potawatomi (76.2%, a difference of 0.010%), Immigrants from Germany (76.2%, a difference of 0.010%), Immigrants from Lithuania (76.1%, a difference of 0.10%), Immigrants from Oceania (76.1%, a difference of 0.10%), and Hungarian (76.3%, a difference of 0.11%).
| Demographics | Rating | Rank | In Labor Force | Age 20-24 |
| Bulgarians | 99.2 /100 | #89 | Exceptional 76.4% |
| Immigrants | Burma/Myanmar | 99.1 /100 | #90 | Exceptional 76.3% |
| Sierra Leoneans | 99.0 /100 | #91 | Exceptional 76.3% |
| Maltese | 98.9 /100 | #92 | Exceptional 76.3% |
| Hungarians | 98.9 /100 | #93 | Exceptional 76.3% |
| Potawatomi | 98.5 /100 | #94 | Exceptional 76.2% |
| Immigrants | Germany | 98.5 /100 | #95 | Exceptional 76.2% |
| Immigrants | Nonimmigrants | 98.5 /100 | #96 | Exceptional 76.2% |
| Immigrants | Lithuania | 98.0 /100 | #97 | Exceptional 76.1% |
| Immigrants | Oceania | 98.0 /100 | #98 | Exceptional 76.1% |
| Americans | 97.8 /100 | #99 | Exceptional 76.1% |
| Shoshone | 97.8 /100 | #100 | Exceptional 76.1% |
| Immigrants | Poland | 97.7 /100 | #101 | Exceptional 76.1% |
| Latvians | 97.6 /100 | #102 | Exceptional 76.1% |
| Immigrants | North Macedonia | 97.5 /100 | #103 | Exceptional 76.1% |
Demographics Similar to Yuman by In Labor Force | Age 20-24
In terms of in labor force | age 20-24, the demographic groups most similar to Yuman are Immigrants from Uzbekistan (70.4%, a difference of 0.23%), British West Indian (70.0%, a difference of 0.41%), Immigrants from Bangladesh (70.6%, a difference of 0.53%), Vietnamese (70.6%, a difference of 0.55%), and Immigrants from Barbados (69.7%, a difference of 0.75%).
| Demographics | Rating | Rank | In Labor Force | Age 20-24 |
| Dominicans | 0.0 /100 | #326 | Tragic 71.1% |
| Immigrants | Trinidad and Tobago | 0.0 /100 | #327 | Tragic 71.1% |
| Immigrants | China | 0.0 /100 | #328 | Tragic 71.1% |
| Yup'ik | 0.0 /100 | #329 | Tragic 70.9% |
| Vietnamese | 0.0 /100 | #330 | Tragic 70.6% |
| Immigrants | Bangladesh | 0.0 /100 | #331 | Tragic 70.6% |
| Immigrants | Uzbekistan | 0.0 /100 | #332 | Tragic 70.4% |
| Yuman | 0.0 /100 | #333 | Tragic 70.3% |
| British West Indians | 0.0 /100 | #334 | Tragic 70.0% |
| Immigrants | Barbados | 0.0 /100 | #335 | Tragic 69.7% |
| Immigrants | Guyana | 0.0 /100 | #336 | Tragic 69.3% |
| Guyanese | 0.0 /100 | #337 | Tragic 69.2% |
| Pima | 0.0 /100 | #338 | Tragic 69.0% |
| Immigrants | Yemen | 0.0 /100 | #339 | Tragic 68.9% |
| Menominee | 0.0 /100 | #340 | Tragic 68.7% |