Immigrants from Central America vs Yuman In Labor Force | Age 20-24
COMPARE
Immigrants from Central America
Yuman
In Labor Force | Age 20-24
In Labor Force | Age 20-24 Comparison
Immigrants from Central America
Yuman
75.0%
IN LABOR FORCE | AGE 20-24
45.0/ 100
METRIC RATING
178th/ 347
METRIC RANK
70.3%
IN LABOR FORCE | AGE 20-24
0.0/ 100
METRIC RATING
333rd/ 347
METRIC RANK
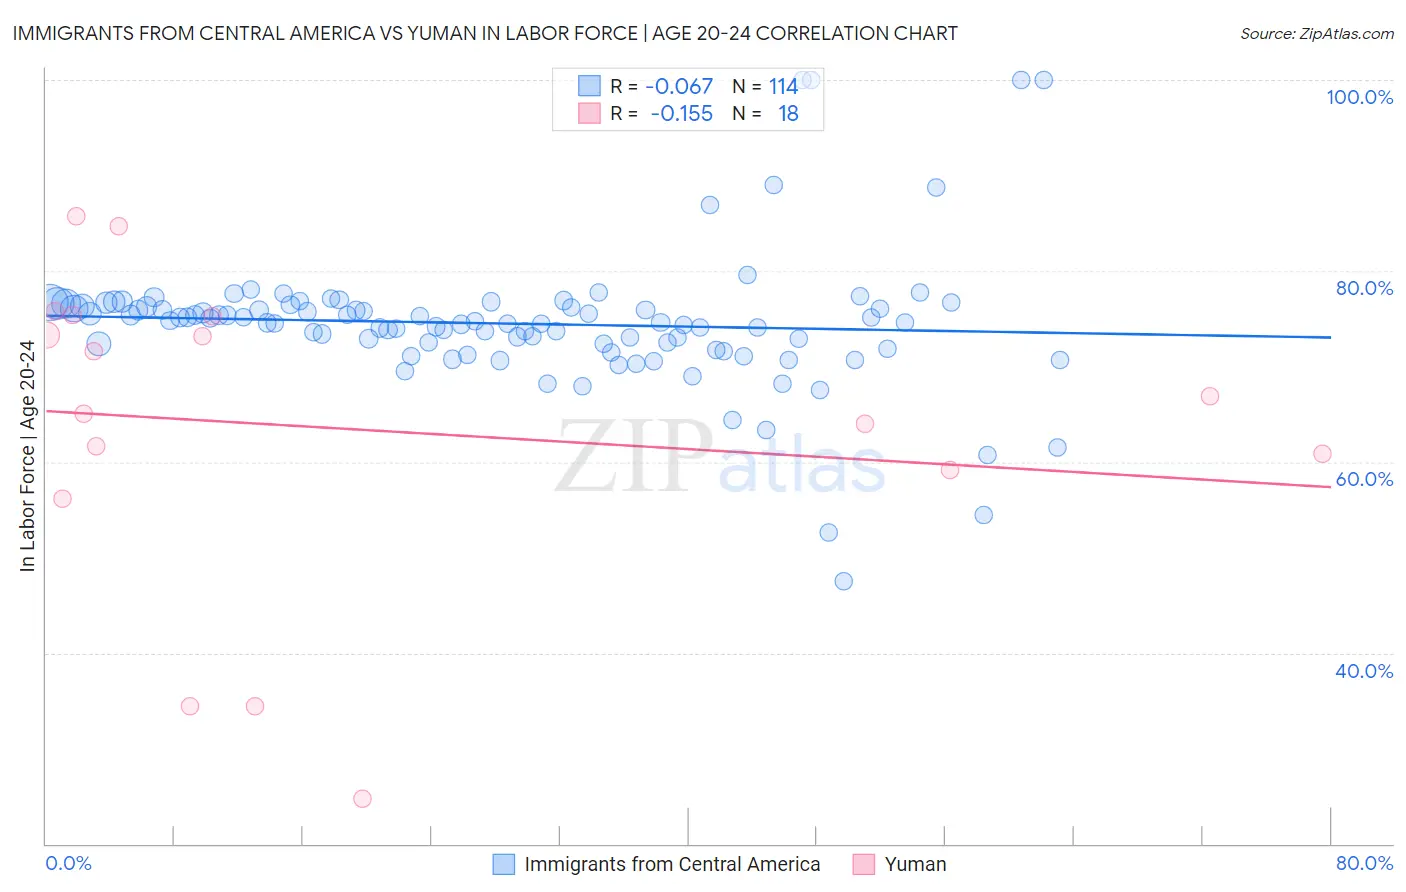
Immigrants from Central America vs Yuman In Labor Force | Age 20-24 Correlation Chart
The statistical analysis conducted on geographies consisting of 535,780,199 people shows a slight negative correlation between the proportion of Immigrants from Central America and labor force participation rate among population between the ages 20 and 24 in the United States with a correlation coefficient (R) of -0.067 and weighted average of 75.0%. Similarly, the statistical analysis conducted on geographies consisting of 40,677,141 people shows a poor negative correlation between the proportion of Yuman and labor force participation rate among population between the ages 20 and 24 in the United States with a correlation coefficient (R) of -0.155 and weighted average of 70.3%, a difference of 6.8%.
In Labor Force | Age 20-24 Correlation Summary
| Measurement | Immigrants from Central America | Yuman |
| Minimum | 47.5% | 24.7% |
| Maximum | 100.0% | 85.7% |
| Range | 52.5% | 61.0% |
| Mean | 74.5% | 63.4% |
| Median | 74.6% | 66.0% |
| Interquartile 25% (IQ1) | 72.4% | 59.1% |
| Interquartile 75% (IQ3) | 76.3% | 75.2% |
| Interquartile Range (IQR) | 4.0% | 16.1% |
| Standard Deviation (Sample) | 7.3% | 17.0% |
| Standard Deviation (Population) | 7.3% | 16.5% |
Similar Demographics by In Labor Force | Age 20-24
Demographics Similar to Immigrants from Central America by In Labor Force | Age 20-24
In terms of in labor force | age 20-24, the demographic groups most similar to Immigrants from Central America are Immigrants from Latvia (75.0%, a difference of 0.010%), Immigrants from Czechoslovakia (75.0%, a difference of 0.010%), Immigrants from Mexico (75.0%, a difference of 0.040%), African (75.0%, a difference of 0.040%), and Central American (75.0%, a difference of 0.050%).
| Demographics | Rating | Rank | In Labor Force | Age 20-24 |
| Cajuns | 51.1 /100 | #171 | Average 75.1% |
| Yakama | 50.8 /100 | #172 | Average 75.1% |
| Immigrants | Croatia | 50.2 /100 | #173 | Average 75.1% |
| South Africans | 50.0 /100 | #174 | Average 75.0% |
| Syrians | 49.5 /100 | #175 | Average 75.0% |
| Central Americans | 48.7 /100 | #176 | Average 75.0% |
| Immigrants | Mexico | 47.8 /100 | #177 | Average 75.0% |
| Immigrants | Central America | 45.0 /100 | #178 | Average 75.0% |
| Immigrants | Latvia | 44.1 /100 | #179 | Average 75.0% |
| Immigrants | Czechoslovakia | 44.0 /100 | #180 | Average 75.0% |
| Africans | 42.5 /100 | #181 | Average 75.0% |
| Immigrants | South Africa | 36.9 /100 | #182 | Fair 74.9% |
| Immigrants | Costa Rica | 36.7 /100 | #183 | Fair 74.9% |
| Immigrants | Hungary | 35.0 /100 | #184 | Fair 74.9% |
| Sri Lankans | 34.9 /100 | #185 | Fair 74.9% |
Demographics Similar to Yuman by In Labor Force | Age 20-24
In terms of in labor force | age 20-24, the demographic groups most similar to Yuman are Immigrants from Uzbekistan (70.4%, a difference of 0.23%), British West Indian (70.0%, a difference of 0.41%), Immigrants from Bangladesh (70.6%, a difference of 0.53%), Vietnamese (70.6%, a difference of 0.55%), and Immigrants from Barbados (69.7%, a difference of 0.75%).
| Demographics | Rating | Rank | In Labor Force | Age 20-24 |
| Dominicans | 0.0 /100 | #326 | Tragic 71.1% |
| Immigrants | Trinidad and Tobago | 0.0 /100 | #327 | Tragic 71.1% |
| Immigrants | China | 0.0 /100 | #328 | Tragic 71.1% |
| Yup'ik | 0.0 /100 | #329 | Tragic 70.9% |
| Vietnamese | 0.0 /100 | #330 | Tragic 70.6% |
| Immigrants | Bangladesh | 0.0 /100 | #331 | Tragic 70.6% |
| Immigrants | Uzbekistan | 0.0 /100 | #332 | Tragic 70.4% |
| Yuman | 0.0 /100 | #333 | Tragic 70.3% |
| British West Indians | 0.0 /100 | #334 | Tragic 70.0% |
| Immigrants | Barbados | 0.0 /100 | #335 | Tragic 69.7% |
| Immigrants | Guyana | 0.0 /100 | #336 | Tragic 69.3% |
| Guyanese | 0.0 /100 | #337 | Tragic 69.2% |
| Pima | 0.0 /100 | #338 | Tragic 69.0% |
| Immigrants | Yemen | 0.0 /100 | #339 | Tragic 68.9% |
| Menominee | 0.0 /100 | #340 | Tragic 68.7% |