Bahamian vs Korean In Labor Force | Age > 16
COMPARE
Bahamian
Korean
In Labor Force | Age > 16
In Labor Force | Age > 16 Comparison
Bahamians
Koreans
64.2%
IN LABOR FORCE | AGE > 16
0.6/ 100
METRIC RATING
263rd/ 347
METRIC RANK
65.7%
IN LABOR FORCE | AGE > 16
95.3/ 100
METRIC RATING
126th/ 347
METRIC RANK
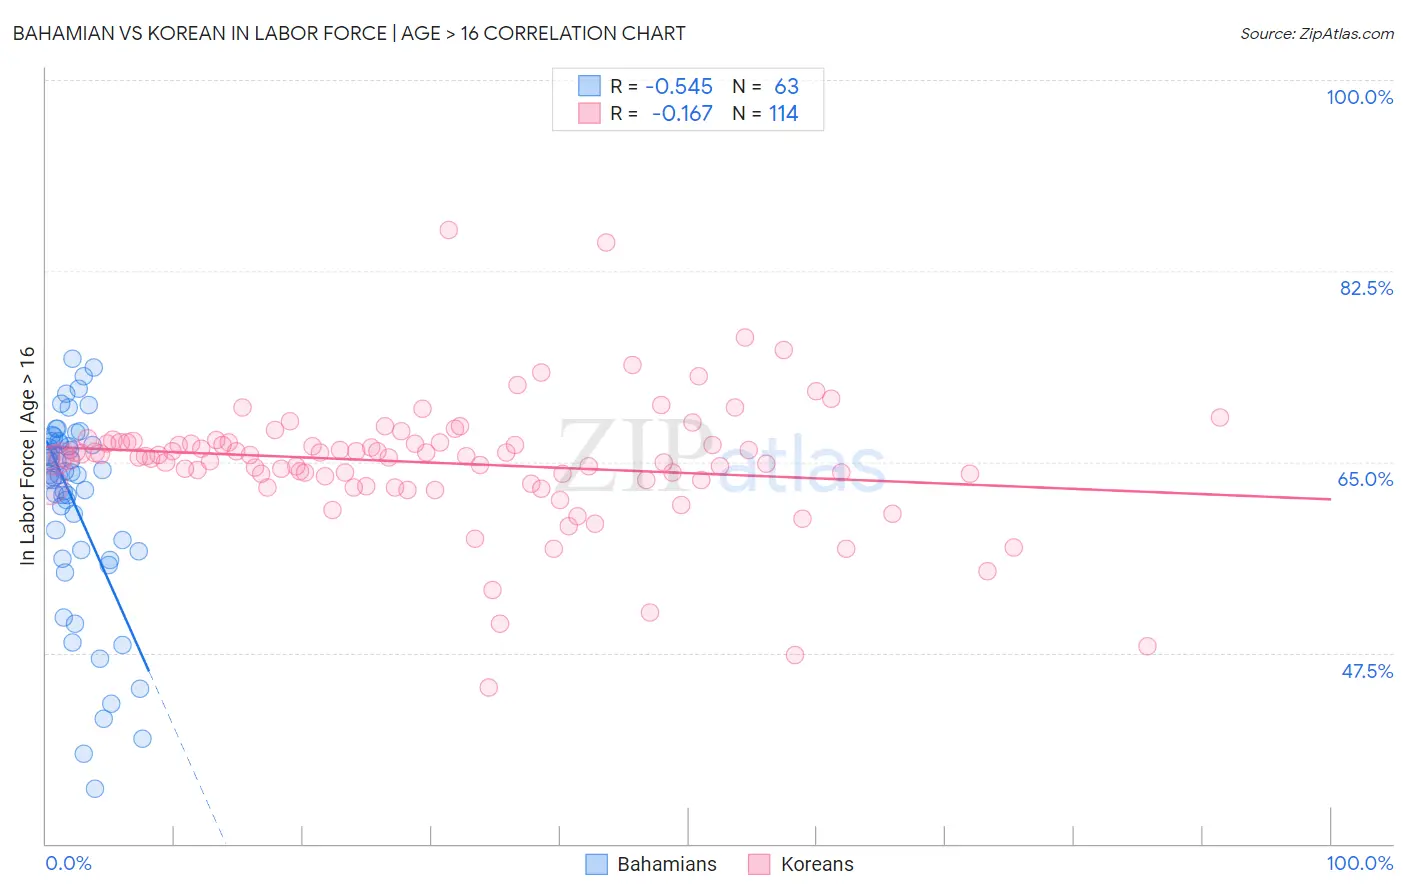
Bahamian vs Korean In Labor Force | Age > 16 Correlation Chart
The statistical analysis conducted on geographies consisting of 112,706,440 people shows a substantial negative correlation between the proportion of Bahamians and labor force participation rate among population ages 16 and over in the United States with a correlation coefficient (R) of -0.545 and weighted average of 64.2%. Similarly, the statistical analysis conducted on geographies consisting of 510,971,555 people shows a poor negative correlation between the proportion of Koreans and labor force participation rate among population ages 16 and over in the United States with a correlation coefficient (R) of -0.167 and weighted average of 65.7%, a difference of 2.3%.
In Labor Force | Age > 16 Correlation Summary
| Measurement | Bahamian | Korean |
| Minimum | 35.0% | 44.3% |
| Maximum | 74.5% | 86.3% |
| Range | 39.5% | 42.0% |
| Mean | 61.0% | 64.9% |
| Median | 63.8% | 65.6% |
| Interquartile 25% (IQ1) | 56.8% | 63.3% |
| Interquartile 75% (IQ3) | 66.9% | 66.8% |
| Interquartile Range (IQR) | 10.1% | 3.5% |
| Standard Deviation (Sample) | 9.1% | 5.8% |
| Standard Deviation (Population) | 9.1% | 5.8% |
Similar Demographics by In Labor Force | Age > 16
Demographics Similar to Bahamians by In Labor Force | Age > 16
In terms of in labor force | age > 16, the demographic groups most similar to Bahamians are Finnish (64.2%, a difference of 0.010%), Dutch (64.2%, a difference of 0.020%), Marshallese (64.2%, a difference of 0.030%), Basque (64.2%, a difference of 0.030%), and Immigrants from Western Europe (64.2%, a difference of 0.040%).
| Demographics | Rating | Rank | In Labor Force | Age > 16 |
| Immigrants | Mexico | 1.0 /100 | #256 | Tragic 64.3% |
| Inupiat | 0.8 /100 | #257 | Tragic 64.3% |
| Immigrants | Scotland | 0.8 /100 | #258 | Tragic 64.2% |
| Immigrants | Western Europe | 0.7 /100 | #259 | Tragic 64.2% |
| Marshallese | 0.7 /100 | #260 | Tragic 64.2% |
| Basques | 0.7 /100 | #261 | Tragic 64.2% |
| Finns | 0.7 /100 | #262 | Tragic 64.2% |
| Bahamians | 0.6 /100 | #263 | Tragic 64.2% |
| Dutch | 0.6 /100 | #264 | Tragic 64.2% |
| Cubans | 0.5 /100 | #265 | Tragic 64.2% |
| Immigrants | England | 0.5 /100 | #266 | Tragic 64.2% |
| Canadians | 0.5 /100 | #267 | Tragic 64.1% |
| Spaniards | 0.5 /100 | #268 | Tragic 64.1% |
| Irish | 0.4 /100 | #269 | Tragic 64.1% |
| Guyanese | 0.4 /100 | #270 | Tragic 64.1% |
Demographics Similar to Koreans by In Labor Force | Age > 16
In terms of in labor force | age > 16, the demographic groups most similar to Koreans are Norwegian (65.7%, a difference of 0.0%), Immigrants from Iraq (65.7%, a difference of 0.010%), Iraqi (65.7%, a difference of 0.010%), Immigrants from Eastern Asia (65.7%, a difference of 0.020%), and Ecuadorian (65.6%, a difference of 0.030%).
| Demographics | Rating | Rank | In Labor Force | Age > 16 |
| Immigrants | France | 96.4 /100 | #119 | Exceptional 65.7% |
| Immigrants | Hong Kong | 96.2 /100 | #120 | Exceptional 65.7% |
| New Zealanders | 96.0 /100 | #121 | Exceptional 65.7% |
| Immigrants | Ecuador | 95.9 /100 | #122 | Exceptional 65.7% |
| Immigrants | Iraq | 95.5 /100 | #123 | Exceptional 65.7% |
| Iraqis | 95.4 /100 | #124 | Exceptional 65.7% |
| Norwegians | 95.3 /100 | #125 | Exceptional 65.7% |
| Koreans | 95.3 /100 | #126 | Exceptional 65.7% |
| Immigrants | Eastern Asia | 94.9 /100 | #127 | Exceptional 65.7% |
| Ecuadorians | 94.7 /100 | #128 | Exceptional 65.6% |
| Immigrants | Philippines | 94.5 /100 | #129 | Exceptional 65.6% |
| Immigrants | Guatemala | 94.4 /100 | #130 | Exceptional 65.6% |
| Icelanders | 94.3 /100 | #131 | Exceptional 65.6% |
| Immigrants | North Macedonia | 94.1 /100 | #132 | Exceptional 65.6% |
| Immigrants | Lithuania | 93.5 /100 | #133 | Exceptional 65.6% |