Bahamian vs Korean Householder Income Ages 45 - 64 years
COMPARE
Bahamian
Korean
Householder Income Ages 45 - 64 years
Householder Income Ages 45 - 64 years Comparison
Bahamians
Koreans
$81,369
HOUSEHOLDER INCOME AGES 45 - 64 YEARS
0.0/ 100
METRIC RATING
323rd/ 347
METRIC RANK
$110,334
HOUSEHOLDER INCOME AGES 45 - 64 YEARS
99.3/ 100
METRIC RATING
70th/ 347
METRIC RANK
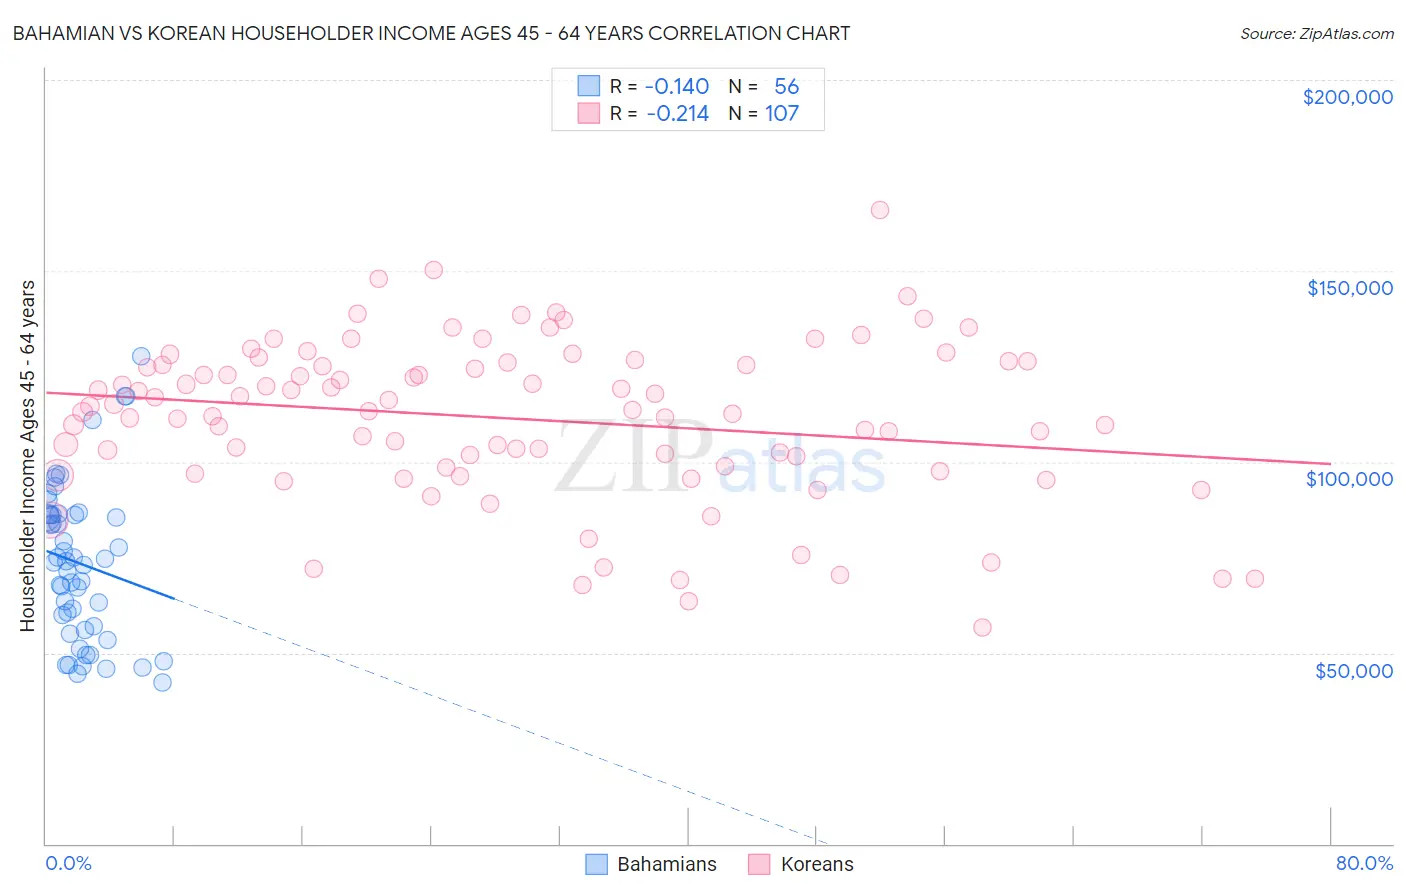
Bahamian vs Korean Householder Income Ages 45 - 64 years Correlation Chart
The statistical analysis conducted on geographies consisting of 112,556,125 people shows a poor negative correlation between the proportion of Bahamians and household income with householder between the ages 45 and 64 in the United States with a correlation coefficient (R) of -0.140 and weighted average of $81,369. Similarly, the statistical analysis conducted on geographies consisting of 509,189,713 people shows a weak negative correlation between the proportion of Koreans and household income with householder between the ages 45 and 64 in the United States with a correlation coefficient (R) of -0.214 and weighted average of $110,334, a difference of 35.6%.
Householder Income Ages 45 - 64 years Correlation Summary
| Measurement | Bahamian | Korean |
| Minimum | $42,237 | $56,563 |
| Maximum | $127,688 | $166,010 |
| Range | $85,451 | $109,447 |
| Mean | $73,458 | $111,314 |
| Median | $73,730 | $113,513 |
| Interquartile 25% (IQ1) | $56,503 | $98,457 |
| Interquartile 75% (IQ3) | $86,250 | $126,141 |
| Interquartile Range (IQR) | $29,747 | $27,684 |
| Standard Deviation (Sample) | $20,194 | $20,923 |
| Standard Deviation (Population) | $20,012 | $20,825 |
Similar Demographics by Householder Income Ages 45 - 64 years
Demographics Similar to Bahamians by Householder Income Ages 45 - 64 years
In terms of householder income ages 45 - 64 years, the demographic groups most similar to Bahamians are Yup'ik ($81,000, a difference of 0.46%), Sioux ($81,750, a difference of 0.47%), Immigrants from Cuba ($80,662, a difference of 0.88%), Dominican ($80,623, a difference of 0.92%), and Yuman ($82,139, a difference of 0.95%).
| Demographics | Rating | Rank | Householder Income Ages 45 - 64 years |
| Immigrants | Caribbean | 0.0 /100 | #316 | Tragic $82,513 |
| Colville | 0.0 /100 | #317 | Tragic $82,474 |
| Choctaw | 0.0 /100 | #318 | Tragic $82,287 |
| Chickasaw | 0.0 /100 | #319 | Tragic $82,193 |
| Apache | 0.0 /100 | #320 | Tragic $82,184 |
| Yuman | 0.0 /100 | #321 | Tragic $82,139 |
| Sioux | 0.0 /100 | #322 | Tragic $81,750 |
| Bahamians | 0.0 /100 | #323 | Tragic $81,369 |
| Yup'ik | 0.0 /100 | #324 | Tragic $81,000 |
| Immigrants | Cuba | 0.0 /100 | #325 | Tragic $80,662 |
| Dominicans | 0.0 /100 | #326 | Tragic $80,623 |
| Seminole | 0.0 /100 | #327 | Tragic $80,077 |
| Natives/Alaskans | 0.0 /100 | #328 | Tragic $79,816 |
| Dutch West Indians | 0.0 /100 | #329 | Tragic $79,171 |
| Creek | 0.0 /100 | #330 | Tragic $78,960 |
Demographics Similar to Koreans by Householder Income Ages 45 - 64 years
In terms of householder income ages 45 - 64 years, the demographic groups most similar to Koreans are Immigrants from Italy ($110,434, a difference of 0.090%), Italian ($110,224, a difference of 0.10%), Assyrian/Chaldean/Syriac ($110,201, a difference of 0.12%), Argentinean ($110,103, a difference of 0.21%), and Immigrants from Romania ($110,633, a difference of 0.27%).
| Demographics | Rating | Rank | Householder Income Ages 45 - 64 years |
| Mongolians | 99.6 /100 | #63 | Exceptional $111,602 |
| Immigrants | Latvia | 99.6 /100 | #64 | Exceptional $111,454 |
| Immigrants | Belarus | 99.6 /100 | #65 | Exceptional $111,430 |
| New Zealanders | 99.6 /100 | #66 | Exceptional $111,286 |
| Laotians | 99.5 /100 | #67 | Exceptional $111,051 |
| Immigrants | Romania | 99.4 /100 | #68 | Exceptional $110,633 |
| Immigrants | Italy | 99.4 /100 | #69 | Exceptional $110,434 |
| Koreans | 99.3 /100 | #70 | Exceptional $110,334 |
| Italians | 99.3 /100 | #71 | Exceptional $110,224 |
| Assyrians/Chaldeans/Syriacs | 99.3 /100 | #72 | Exceptional $110,201 |
| Argentineans | 99.3 /100 | #73 | Exceptional $110,103 |
| Immigrants | Egypt | 99.2 /100 | #74 | Exceptional $109,941 |
| South Africans | 99.1 /100 | #75 | Exceptional $109,719 |
| Paraguayans | 99.0 /100 | #76 | Exceptional $109,447 |
| Immigrants | England | 99.0 /100 | #77 | Exceptional $109,446 |