Armenian vs Korean In Labor Force | Age 20-24
COMPARE
Armenian
Korean
In Labor Force | Age 20-24
In Labor Force | Age 20-24 Comparison
Armenians
Koreans
72.5%
IN LABOR FORCE | AGE 20-24
0.0/ 100
METRIC RATING
300th/ 347
METRIC RANK
75.4%
IN LABOR FORCE | AGE 20-24
79.7/ 100
METRIC RATING
145th/ 347
METRIC RANK
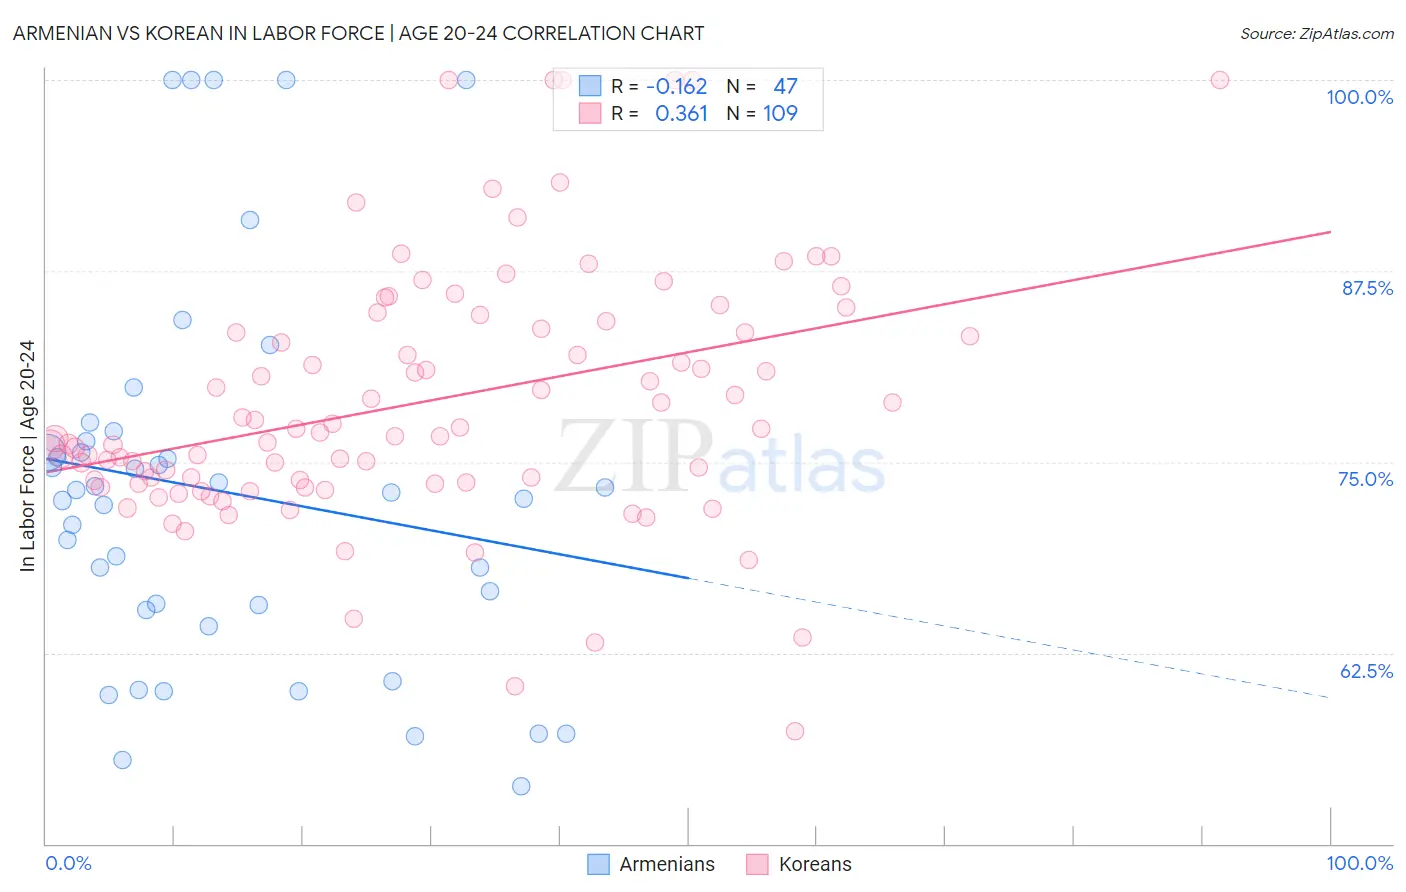
Armenian vs Korean In Labor Force | Age 20-24 Correlation Chart
The statistical analysis conducted on geographies consisting of 310,817,761 people shows a poor negative correlation between the proportion of Armenians and labor force participation rate among population between the ages 20 and 24 in the United States with a correlation coefficient (R) of -0.162 and weighted average of 72.5%. Similarly, the statistical analysis conducted on geographies consisting of 510,540,688 people shows a mild positive correlation between the proportion of Koreans and labor force participation rate among population between the ages 20 and 24 in the United States with a correlation coefficient (R) of 0.361 and weighted average of 75.4%, a difference of 4.0%.
In Labor Force | Age 20-24 Correlation Summary
| Measurement | Armenian | Korean |
| Minimum | 53.8% | 57.4% |
| Maximum | 100.0% | 100.0% |
| Range | 46.2% | 42.6% |
| Mean | 73.0% | 79.0% |
| Median | 73.0% | 76.9% |
| Interquartile 25% (IQ1) | 65.3% | 73.6% |
| Interquartile 75% (IQ3) | 76.4% | 84.0% |
| Interquartile Range (IQR) | 11.1% | 10.3% |
| Standard Deviation (Sample) | 12.3% | 8.4% |
| Standard Deviation (Population) | 12.2% | 8.3% |
Similar Demographics by In Labor Force | Age 20-24
Demographics Similar to Armenians by In Labor Force | Age 20-24
In terms of in labor force | age 20-24, the demographic groups most similar to Armenians are Iranian (72.6%, a difference of 0.020%), Israeli (72.6%, a difference of 0.070%), Cuban (72.5%, a difference of 0.070%), Native/Alaskan (72.4%, a difference of 0.16%), and Ecuadorian (72.4%, a difference of 0.17%).
| Demographics | Rating | Rank | In Labor Force | Age 20-24 |
| Immigrants | Belize | 0.0 /100 | #293 | Tragic 72.8% |
| Immigrants | Argentina | 0.0 /100 | #294 | Tragic 72.8% |
| Okinawans | 0.0 /100 | #295 | Tragic 72.7% |
| Jamaicans | 0.0 /100 | #296 | Tragic 72.7% |
| Central American Indians | 0.0 /100 | #297 | Tragic 72.7% |
| Israelis | 0.0 /100 | #298 | Tragic 72.6% |
| Iranians | 0.0 /100 | #299 | Tragic 72.6% |
| Armenians | 0.0 /100 | #300 | Tragic 72.5% |
| Cubans | 0.0 /100 | #301 | Tragic 72.5% |
| Natives/Alaskans | 0.0 /100 | #302 | Tragic 72.4% |
| Ecuadorians | 0.0 /100 | #303 | Tragic 72.4% |
| Immigrants | West Indies | 0.0 /100 | #304 | Tragic 72.4% |
| Immigrants | Singapore | 0.0 /100 | #305 | Tragic 72.4% |
| Immigrants | Jamaica | 0.0 /100 | #306 | Tragic 72.4% |
| Immigrants | Ecuador | 0.0 /100 | #307 | Tragic 72.3% |
Demographics Similar to Koreans by In Labor Force | Age 20-24
In terms of in labor force | age 20-24, the demographic groups most similar to Koreans are Mexican American Indian (75.4%, a difference of 0.020%), Bhutanese (75.4%, a difference of 0.030%), Spaniard (75.5%, a difference of 0.050%), Comanche (75.4%, a difference of 0.050%), and Immigrants from Cambodia (75.4%, a difference of 0.060%).
| Demographics | Rating | Rank | In Labor Force | Age 20-24 |
| Australians | 84.8 /100 | #138 | Excellent 75.5% |
| Immigrants | England | 84.6 /100 | #139 | Excellent 75.5% |
| Delaware | 84.5 /100 | #140 | Excellent 75.5% |
| Romanians | 84.1 /100 | #141 | Excellent 75.5% |
| Blackfeet | 83.6 /100 | #142 | Excellent 75.5% |
| Spaniards | 82.0 /100 | #143 | Excellent 75.5% |
| Bhutanese | 80.8 /100 | #144 | Excellent 75.4% |
| Koreans | 79.7 /100 | #145 | Good 75.4% |
| Mexican American Indians | 78.8 /100 | #146 | Good 75.4% |
| Comanche | 77.6 /100 | #147 | Good 75.4% |
| Immigrants | Cambodia | 76.7 /100 | #148 | Good 75.4% |
| Ugandans | 76.1 /100 | #149 | Good 75.4% |
| Salvadorans | 74.8 /100 | #150 | Good 75.3% |
| Paiute | 74.1 /100 | #151 | Good 75.3% |
| Lebanese | 73.5 /100 | #152 | Good 75.3% |