Bahamian vs Immigrants from Netherlands In Labor Force | Age > 16
COMPARE
Bahamian
Immigrants from Netherlands
In Labor Force | Age > 16
In Labor Force | Age > 16 Comparison
Bahamians
Immigrants from Netherlands
64.2%
IN LABOR FORCE | AGE > 16
0.6/ 100
METRIC RATING
263rd/ 347
METRIC RANK
64.5%
IN LABOR FORCE | AGE > 16
3.4/ 100
METRIC RATING
242nd/ 347
METRIC RANK
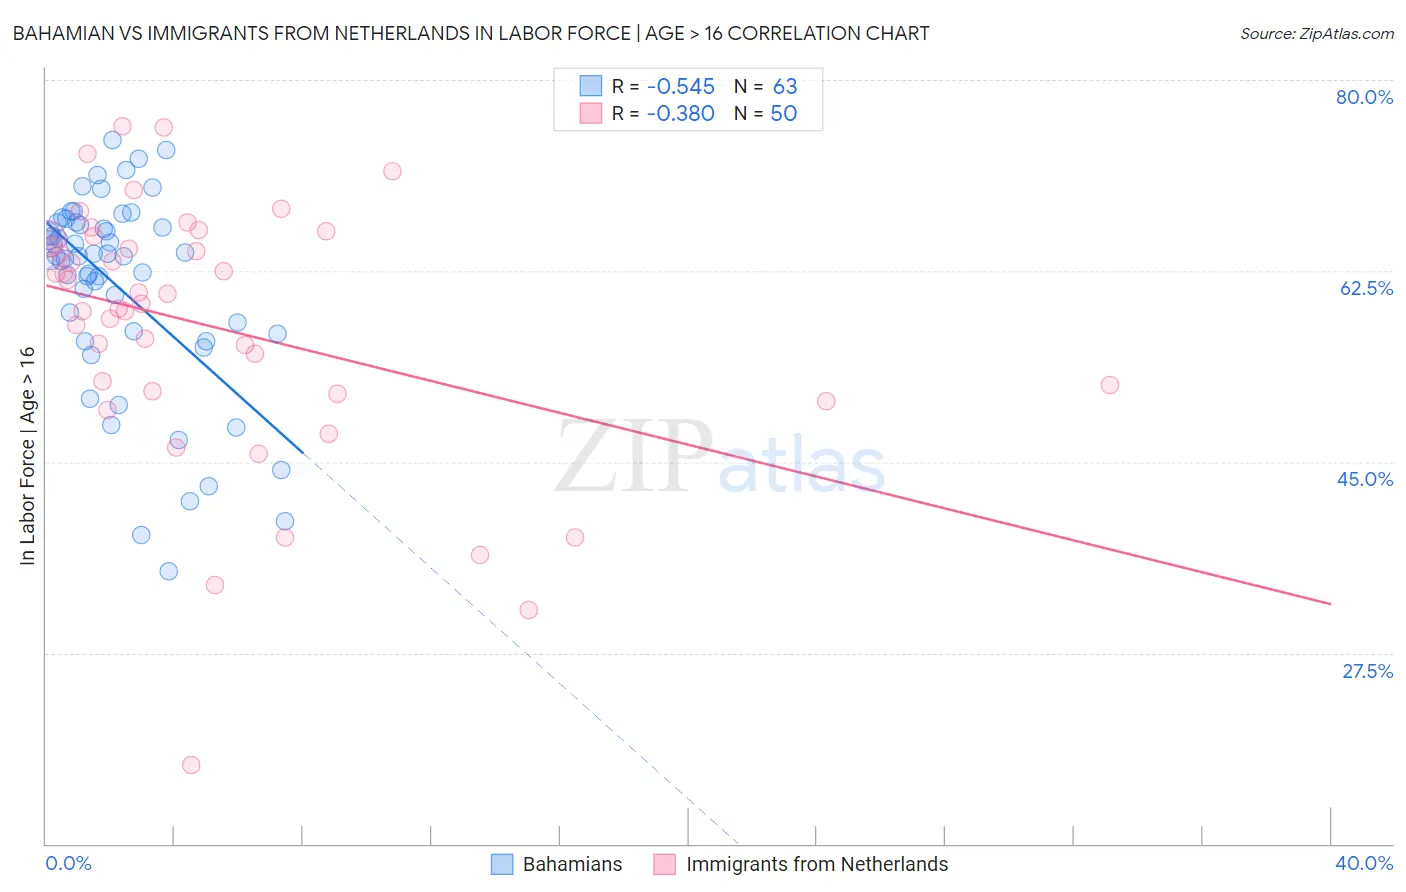
Bahamian vs Immigrants from Netherlands In Labor Force | Age > 16 Correlation Chart
The statistical analysis conducted on geographies consisting of 112,706,440 people shows a substantial negative correlation between the proportion of Bahamians and labor force participation rate among population ages 16 and over in the United States with a correlation coefficient (R) of -0.545 and weighted average of 64.2%. Similarly, the statistical analysis conducted on geographies consisting of 237,884,135 people shows a mild negative correlation between the proportion of Immigrants from Netherlands and labor force participation rate among population ages 16 and over in the United States with a correlation coefficient (R) of -0.380 and weighted average of 64.5%, a difference of 0.49%.
In Labor Force | Age > 16 Correlation Summary
| Measurement | Bahamian | Immigrants from Netherlands |
| Minimum | 35.0% | 17.2% |
| Maximum | 74.5% | 75.8% |
| Range | 39.5% | 58.5% |
| Mean | 61.0% | 57.4% |
| Median | 63.8% | 60.0% |
| Interquartile 25% (IQ1) | 56.8% | 51.5% |
| Interquartile 75% (IQ3) | 66.9% | 65.4% |
| Interquartile Range (IQR) | 10.1% | 13.9% |
| Standard Deviation (Sample) | 9.1% | 11.9% |
| Standard Deviation (Population) | 9.1% | 11.8% |
Similar Demographics by In Labor Force | Age > 16
Demographics Similar to Bahamians by In Labor Force | Age > 16
In terms of in labor force | age > 16, the demographic groups most similar to Bahamians are Finnish (64.2%, a difference of 0.010%), Dutch (64.2%, a difference of 0.020%), Marshallese (64.2%, a difference of 0.030%), Basque (64.2%, a difference of 0.030%), and Immigrants from Western Europe (64.2%, a difference of 0.040%).
| Demographics | Rating | Rank | In Labor Force | Age > 16 |
| Immigrants | Mexico | 1.0 /100 | #256 | Tragic 64.3% |
| Inupiat | 0.8 /100 | #257 | Tragic 64.3% |
| Immigrants | Scotland | 0.8 /100 | #258 | Tragic 64.2% |
| Immigrants | Western Europe | 0.7 /100 | #259 | Tragic 64.2% |
| Marshallese | 0.7 /100 | #260 | Tragic 64.2% |
| Basques | 0.7 /100 | #261 | Tragic 64.2% |
| Finns | 0.7 /100 | #262 | Tragic 64.2% |
| Bahamians | 0.6 /100 | #263 | Tragic 64.2% |
| Dutch | 0.6 /100 | #264 | Tragic 64.2% |
| Cubans | 0.5 /100 | #265 | Tragic 64.2% |
| Immigrants | England | 0.5 /100 | #266 | Tragic 64.2% |
| Canadians | 0.5 /100 | #267 | Tragic 64.1% |
| Spaniards | 0.5 /100 | #268 | Tragic 64.1% |
| Irish | 0.4 /100 | #269 | Tragic 64.1% |
| Guyanese | 0.4 /100 | #270 | Tragic 64.1% |
Demographics Similar to Immigrants from Netherlands by In Labor Force | Age > 16
In terms of in labor force | age > 16, the demographic groups most similar to Immigrants from Netherlands are Immigrants from Dominica (64.5%, a difference of 0.010%), Immigrants from Lebanon (64.5%, a difference of 0.010%), Immigrants from Bangladesh (64.5%, a difference of 0.020%), Immigrants from Hungary (64.5%, a difference of 0.030%), and Tsimshian (64.5%, a difference of 0.030%).
| Demographics | Rating | Rank | In Labor Force | Age > 16 |
| Austrians | 4.6 /100 | #235 | Tragic 64.6% |
| Immigrants | Norway | 4.6 /100 | #236 | Tragic 64.6% |
| Italians | 4.6 /100 | #237 | Tragic 64.6% |
| Lebanese | 3.9 /100 | #238 | Tragic 64.5% |
| Immigrants | Hungary | 3.8 /100 | #239 | Tragic 64.5% |
| Immigrants | Bangladesh | 3.6 /100 | #240 | Tragic 64.5% |
| Immigrants | Dominica | 3.5 /100 | #241 | Tragic 64.5% |
| Immigrants | Netherlands | 3.4 /100 | #242 | Tragic 64.5% |
| Immigrants | Lebanon | 3.2 /100 | #243 | Tragic 64.5% |
| Tsimshian | 3.1 /100 | #244 | Tragic 64.5% |
| West Indians | 3.0 /100 | #245 | Tragic 64.5% |
| Immigrants | Caribbean | 2.3 /100 | #246 | Tragic 64.4% |
| Swiss | 2.1 /100 | #247 | Tragic 64.4% |
| Immigrants | Barbados | 2.1 /100 | #248 | Tragic 64.4% |
| Germans | 1.8 /100 | #249 | Tragic 64.4% |