Ottawa vs Korean In Labor Force | Age > 16
COMPARE
Ottawa
Korean
In Labor Force | Age > 16
In Labor Force | Age > 16 Comparison
Ottawa
Koreans
62.0%
IN LABOR FORCE | AGE > 16
0.0/ 100
METRIC RATING
322nd/ 347
METRIC RANK
65.7%
IN LABOR FORCE | AGE > 16
95.3/ 100
METRIC RATING
126th/ 347
METRIC RANK
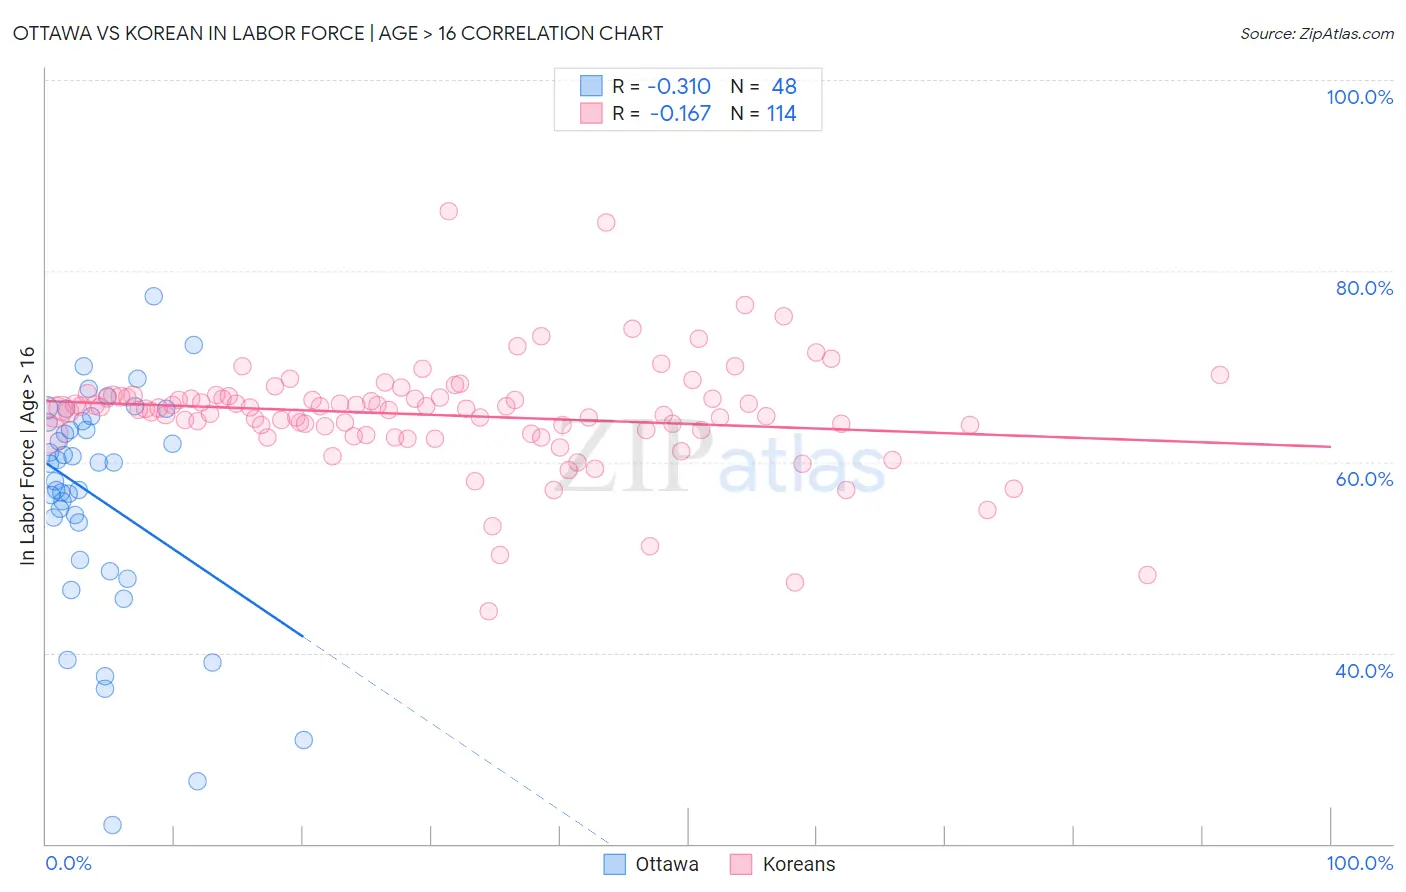
Ottawa vs Korean In Labor Force | Age > 16 Correlation Chart
The statistical analysis conducted on geographies consisting of 49,955,399 people shows a mild negative correlation between the proportion of Ottawa and labor force participation rate among population ages 16 and over in the United States with a correlation coefficient (R) of -0.310 and weighted average of 62.0%. Similarly, the statistical analysis conducted on geographies consisting of 510,971,555 people shows a poor negative correlation between the proportion of Koreans and labor force participation rate among population ages 16 and over in the United States with a correlation coefficient (R) of -0.167 and weighted average of 65.7%, a difference of 5.9%.
In Labor Force | Age > 16 Correlation Summary
| Measurement | Ottawa | Korean |
| Minimum | 21.9% | 44.3% |
| Maximum | 77.4% | 86.3% |
| Range | 55.5% | 42.0% |
| Mean | 56.2% | 64.9% |
| Median | 59.9% | 65.6% |
| Interquartile 25% (IQ1) | 51.7% | 63.3% |
| Interquartile 75% (IQ3) | 64.2% | 66.8% |
| Interquartile Range (IQR) | 12.5% | 3.5% |
| Standard Deviation (Sample) | 11.9% | 5.8% |
| Standard Deviation (Population) | 11.7% | 5.8% |
Similar Demographics by In Labor Force | Age > 16
Demographics Similar to Ottawa by In Labor Force | Age > 16
In terms of in labor force | age > 16, the demographic groups most similar to Ottawa are Seminole (62.0%, a difference of 0.030%), Cheyenne (62.0%, a difference of 0.070%), Cherokee (61.9%, a difference of 0.11%), American (62.1%, a difference of 0.16%), and Yakama (62.1%, a difference of 0.19%).
| Demographics | Rating | Rank | In Labor Force | Age > 16 |
| Potawatomi | 0.0 /100 | #315 | Tragic 62.8% |
| Yup'ik | 0.0 /100 | #316 | Tragic 62.7% |
| Kiowa | 0.0 /100 | #317 | Tragic 62.4% |
| Chickasaw | 0.0 /100 | #318 | Tragic 62.3% |
| Arapaho | 0.0 /100 | #319 | Tragic 62.1% |
| Yakama | 0.0 /100 | #320 | Tragic 62.1% |
| Americans | 0.0 /100 | #321 | Tragic 62.1% |
| Ottawa | 0.0 /100 | #322 | Tragic 62.0% |
| Seminole | 0.0 /100 | #323 | Tragic 62.0% |
| Cheyenne | 0.0 /100 | #324 | Tragic 62.0% |
| Cherokee | 0.0 /100 | #325 | Tragic 61.9% |
| Sioux | 0.0 /100 | #326 | Tragic 61.8% |
| Cajuns | 0.0 /100 | #327 | Tragic 61.8% |
| Dutch West Indians | 0.0 /100 | #328 | Tragic 61.7% |
| Choctaw | 0.0 /100 | #329 | Tragic 61.5% |
Demographics Similar to Koreans by In Labor Force | Age > 16
In terms of in labor force | age > 16, the demographic groups most similar to Koreans are Norwegian (65.7%, a difference of 0.0%), Immigrants from Iraq (65.7%, a difference of 0.010%), Iraqi (65.7%, a difference of 0.010%), Immigrants from Eastern Asia (65.7%, a difference of 0.020%), and Ecuadorian (65.6%, a difference of 0.030%).
| Demographics | Rating | Rank | In Labor Force | Age > 16 |
| Immigrants | France | 96.4 /100 | #119 | Exceptional 65.7% |
| Immigrants | Hong Kong | 96.2 /100 | #120 | Exceptional 65.7% |
| New Zealanders | 96.0 /100 | #121 | Exceptional 65.7% |
| Immigrants | Ecuador | 95.9 /100 | #122 | Exceptional 65.7% |
| Immigrants | Iraq | 95.5 /100 | #123 | Exceptional 65.7% |
| Iraqis | 95.4 /100 | #124 | Exceptional 65.7% |
| Norwegians | 95.3 /100 | #125 | Exceptional 65.7% |
| Koreans | 95.3 /100 | #126 | Exceptional 65.7% |
| Immigrants | Eastern Asia | 94.9 /100 | #127 | Exceptional 65.7% |
| Ecuadorians | 94.7 /100 | #128 | Exceptional 65.6% |
| Immigrants | Philippines | 94.5 /100 | #129 | Exceptional 65.6% |
| Immigrants | Guatemala | 94.4 /100 | #130 | Exceptional 65.6% |
| Icelanders | 94.3 /100 | #131 | Exceptional 65.6% |
| Immigrants | North Macedonia | 94.1 /100 | #132 | Exceptional 65.6% |
| Immigrants | Lithuania | 93.5 /100 | #133 | Exceptional 65.6% |