Bahamian vs Immigrants from Albania In Labor Force | Age > 16
COMPARE
Bahamian
Immigrants from Albania
In Labor Force | Age > 16
In Labor Force | Age > 16 Comparison
Bahamians
Immigrants from Albania
64.2%
IN LABOR FORCE | AGE > 16
0.6/ 100
METRIC RATING
263rd/ 347
METRIC RANK
65.4%
IN LABOR FORCE | AGE > 16
85.7/ 100
METRIC RATING
149th/ 347
METRIC RANK
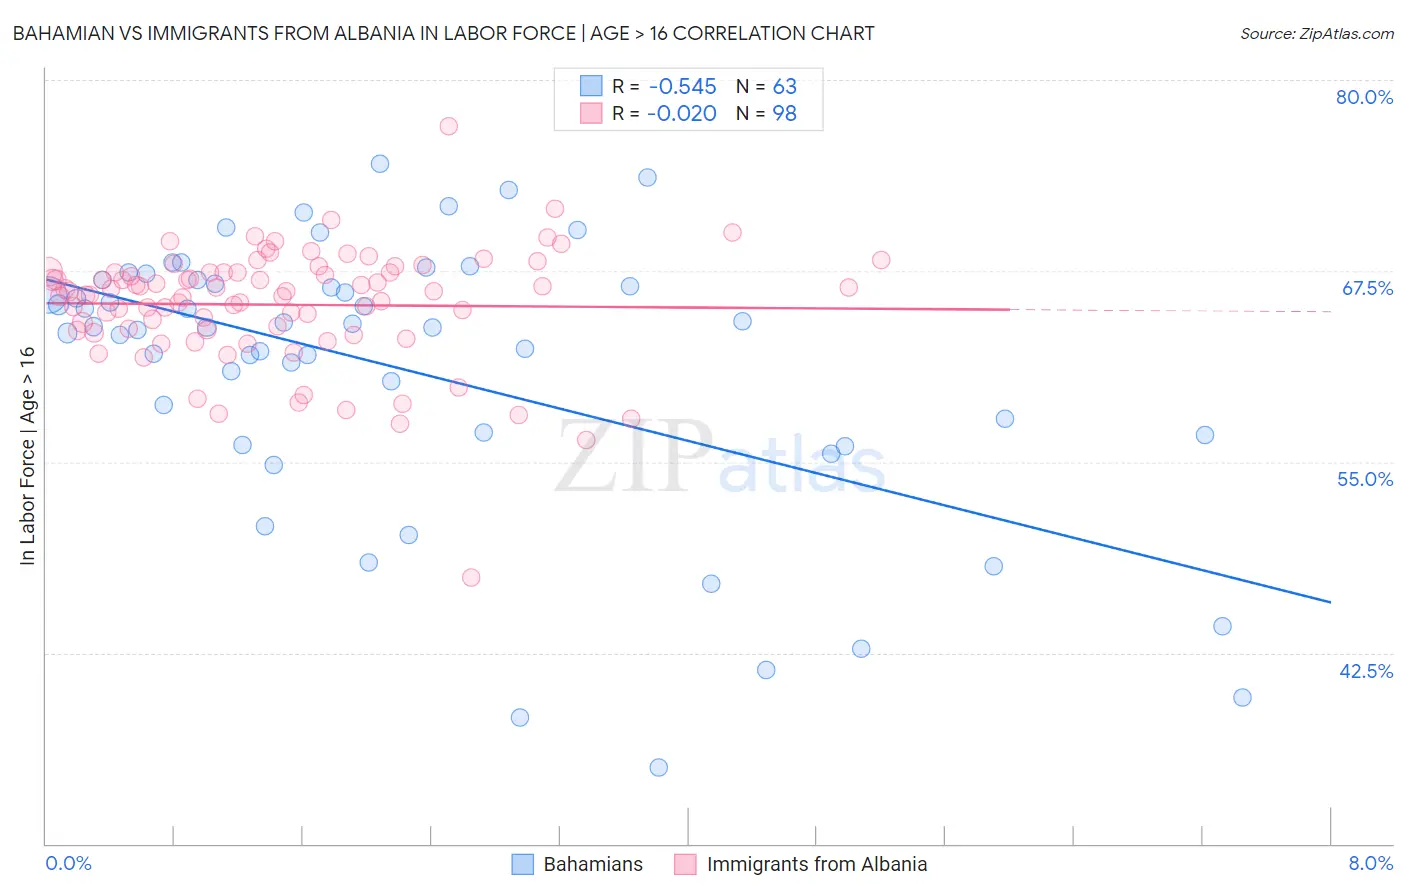
Bahamian vs Immigrants from Albania In Labor Force | Age > 16 Correlation Chart
The statistical analysis conducted on geographies consisting of 112,706,440 people shows a substantial negative correlation between the proportion of Bahamians and labor force participation rate among population ages 16 and over in the United States with a correlation coefficient (R) of -0.545 and weighted average of 64.2%. Similarly, the statistical analysis conducted on geographies consisting of 119,399,287 people shows no correlation between the proportion of Immigrants from Albania and labor force participation rate among population ages 16 and over in the United States with a correlation coefficient (R) of -0.020 and weighted average of 65.4%, a difference of 1.9%.
In Labor Force | Age > 16 Correlation Summary
| Measurement | Bahamian | Immigrants from Albania |
| Minimum | 35.0% | 47.4% |
| Maximum | 74.5% | 77.0% |
| Range | 39.5% | 29.6% |
| Mean | 61.0% | 65.3% |
| Median | 63.8% | 66.2% |
| Interquartile 25% (IQ1) | 56.8% | 63.6% |
| Interquartile 75% (IQ3) | 66.9% | 67.4% |
| Interquartile Range (IQR) | 10.1% | 3.8% |
| Standard Deviation (Sample) | 9.1% | 3.9% |
| Standard Deviation (Population) | 9.1% | 3.9% |
Similar Demographics by In Labor Force | Age > 16
Demographics Similar to Bahamians by In Labor Force | Age > 16
In terms of in labor force | age > 16, the demographic groups most similar to Bahamians are Finnish (64.2%, a difference of 0.010%), Dutch (64.2%, a difference of 0.020%), Marshallese (64.2%, a difference of 0.030%), Basque (64.2%, a difference of 0.030%), and Immigrants from Western Europe (64.2%, a difference of 0.040%).
| Demographics | Rating | Rank | In Labor Force | Age > 16 |
| Immigrants | Mexico | 1.0 /100 | #256 | Tragic 64.3% |
| Inupiat | 0.8 /100 | #257 | Tragic 64.3% |
| Immigrants | Scotland | 0.8 /100 | #258 | Tragic 64.2% |
| Immigrants | Western Europe | 0.7 /100 | #259 | Tragic 64.2% |
| Marshallese | 0.7 /100 | #260 | Tragic 64.2% |
| Basques | 0.7 /100 | #261 | Tragic 64.2% |
| Finns | 0.7 /100 | #262 | Tragic 64.2% |
| Bahamians | 0.6 /100 | #263 | Tragic 64.2% |
| Dutch | 0.6 /100 | #264 | Tragic 64.2% |
| Cubans | 0.5 /100 | #265 | Tragic 64.2% |
| Immigrants | England | 0.5 /100 | #266 | Tragic 64.2% |
| Canadians | 0.5 /100 | #267 | Tragic 64.1% |
| Spaniards | 0.5 /100 | #268 | Tragic 64.1% |
| Irish | 0.4 /100 | #269 | Tragic 64.1% |
| Guyanese | 0.4 /100 | #270 | Tragic 64.1% |
Demographics Similar to Immigrants from Albania by In Labor Force | Age > 16
In terms of in labor force | age > 16, the demographic groups most similar to Immigrants from Albania are Bhutanese (65.5%, a difference of 0.010%), Immigrants from Oceania (65.5%, a difference of 0.040%), Cypriot (65.5%, a difference of 0.060%), Immigrants from Romania (65.5%, a difference of 0.070%), and Tlingit-Haida (65.5%, a difference of 0.070%).
| Demographics | Rating | Rank | In Labor Force | Age > 16 |
| Indians (Asian) | 89.5 /100 | #142 | Excellent 65.5% |
| Latvians | 89.4 /100 | #143 | Excellent 65.5% |
| Immigrants | Romania | 88.6 /100 | #144 | Excellent 65.5% |
| Tlingit-Haida | 88.3 /100 | #145 | Excellent 65.5% |
| Cypriots | 88.2 /100 | #146 | Excellent 65.5% |
| Immigrants | Oceania | 87.5 /100 | #147 | Excellent 65.5% |
| Bhutanese | 86.3 /100 | #148 | Excellent 65.5% |
| Immigrants | Albania | 85.7 /100 | #149 | Excellent 65.4% |
| Immigrants | Immigrants | 81.9 /100 | #150 | Excellent 65.4% |
| Czechs | 81.5 /100 | #151 | Excellent 65.4% |
| Yugoslavians | 81.3 /100 | #152 | Excellent 65.4% |
| Immigrants | China | 80.5 /100 | #153 | Excellent 65.4% |
| Immigrants | Eastern Europe | 78.3 /100 | #154 | Good 65.4% |
| Immigrants | Armenia | 76.6 /100 | #155 | Good 65.3% |
| Immigrants | Ireland | 75.9 /100 | #156 | Good 65.3% |