Austrian vs Immigrants from Italy In Labor Force | Age > 16
COMPARE
Austrian
Immigrants from Italy
In Labor Force | Age > 16
In Labor Force | Age > 16 Comparison
Austrians
Immigrants from Italy
64.6%
IN LABOR FORCE | AGE > 16
4.6/ 100
METRIC RATING
235th/ 347
METRIC RANK
65.0%
IN LABOR FORCE | AGE > 16
28.7/ 100
METRIC RATING
197th/ 347
METRIC RANK
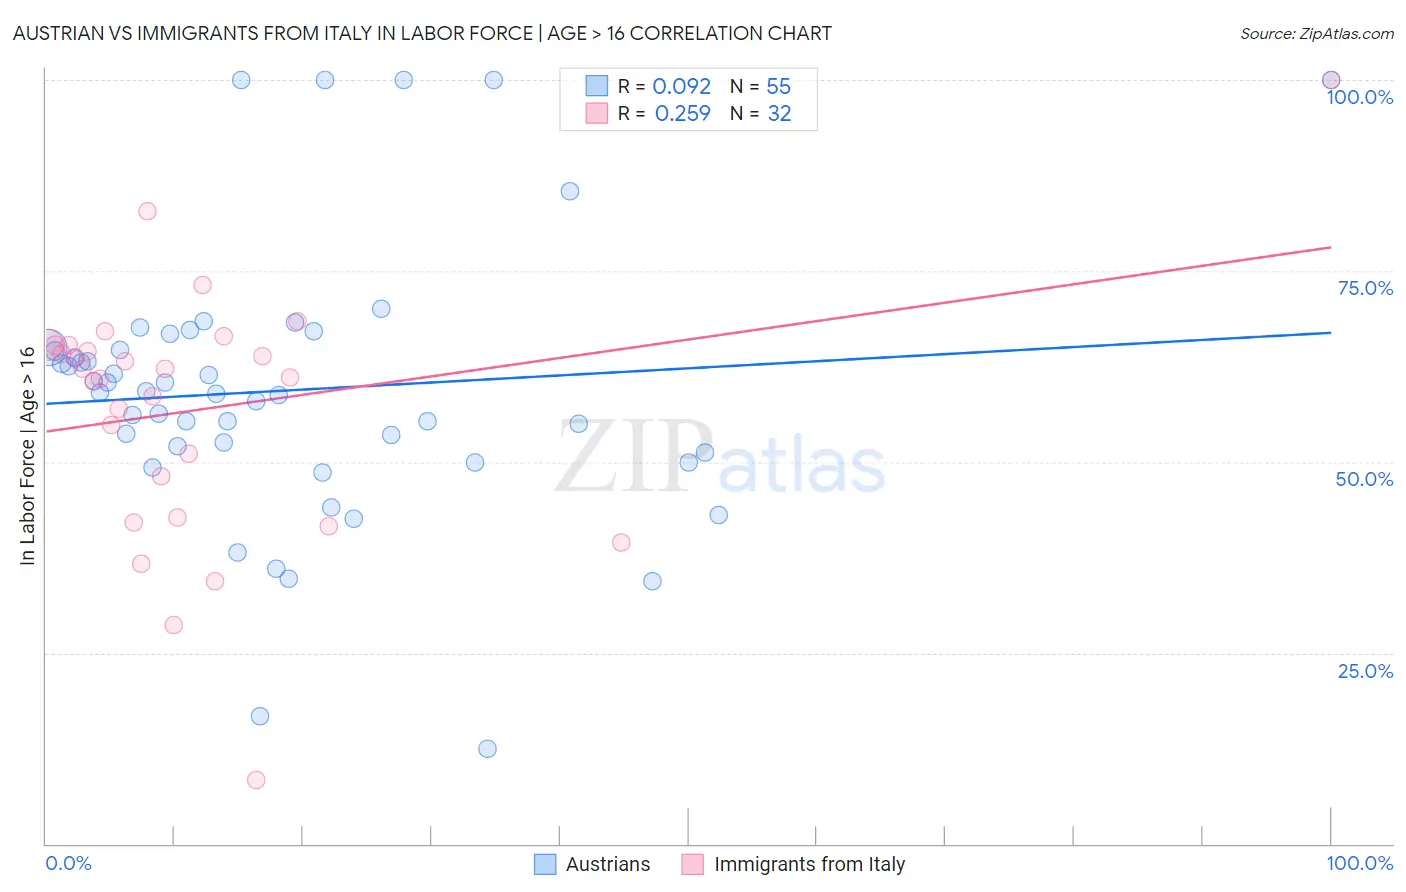
Austrian vs Immigrants from Italy In Labor Force | Age > 16 Correlation Chart
The statistical analysis conducted on geographies consisting of 452,087,528 people shows a slight positive correlation between the proportion of Austrians and labor force participation rate among population ages 16 and over in the United States with a correlation coefficient (R) of 0.092 and weighted average of 64.6%. Similarly, the statistical analysis conducted on geographies consisting of 324,219,565 people shows a weak positive correlation between the proportion of Immigrants from Italy and labor force participation rate among population ages 16 and over in the United States with a correlation coefficient (R) of 0.259 and weighted average of 65.0%, a difference of 0.60%.
In Labor Force | Age > 16 Correlation Summary
| Measurement | Austrian | Immigrants from Italy |
| Minimum | 12.5% | 8.3% |
| Maximum | 100.0% | 100.0% |
| Range | 87.5% | 91.7% |
| Mean | 59.4% | 57.0% |
| Median | 59.1% | 61.6% |
| Interquartile 25% (IQ1) | 51.2% | 45.4% |
| Interquartile 75% (IQ3) | 65.0% | 65.3% |
| Interquartile Range (IQR) | 13.8% | 19.8% |
| Standard Deviation (Sample) | 17.9% | 16.9% |
| Standard Deviation (Population) | 17.8% | 16.6% |
Similar Demographics by In Labor Force | Age > 16
Demographics Similar to Austrians by In Labor Force | Age > 16
In terms of in labor force | age > 16, the demographic groups most similar to Austrians are Vietnamese (64.6%, a difference of 0.0%), Immigrants from Norway (64.6%, a difference of 0.0%), Italian (64.6%, a difference of 0.0%), Slavic (64.6%, a difference of 0.020%), and Lebanese (64.5%, a difference of 0.050%).
| Demographics | Rating | Rank | In Labor Force | Age > 16 |
| Northern Europeans | 8.2 /100 | #228 | Tragic 64.7% |
| British | 7.3 /100 | #229 | Tragic 64.7% |
| Chinese | 7.3 /100 | #230 | Tragic 64.7% |
| Immigrants | Northern Europe | 7.2 /100 | #231 | Tragic 64.7% |
| Africans | 5.8 /100 | #232 | Tragic 64.6% |
| Slavs | 4.9 /100 | #233 | Tragic 64.6% |
| Vietnamese | 4.7 /100 | #234 | Tragic 64.6% |
| Austrians | 4.6 /100 | #235 | Tragic 64.6% |
| Immigrants | Norway | 4.6 /100 | #236 | Tragic 64.6% |
| Italians | 4.6 /100 | #237 | Tragic 64.6% |
| Lebanese | 3.9 /100 | #238 | Tragic 64.5% |
| Immigrants | Hungary | 3.8 /100 | #239 | Tragic 64.5% |
| Immigrants | Bangladesh | 3.6 /100 | #240 | Tragic 64.5% |
| Immigrants | Dominica | 3.5 /100 | #241 | Tragic 64.5% |
| Immigrants | Netherlands | 3.4 /100 | #242 | Tragic 64.5% |
Demographics Similar to Immigrants from Italy by In Labor Force | Age > 16
In terms of in labor force | age > 16, the demographic groups most similar to Immigrants from Italy are Romanian (65.0%, a difference of 0.030%), Haitian (65.0%, a difference of 0.030%), Immigrants from Southern Europe (65.0%, a difference of 0.040%), Greek (64.9%, a difference of 0.040%), and Immigrants from Europe (65.0%, a difference of 0.060%).
| Demographics | Rating | Rank | In Labor Force | Age > 16 |
| Barbadians | 33.9 /100 | #190 | Fair 65.0% |
| Scandinavians | 33.7 /100 | #191 | Fair 65.0% |
| Immigrants | Fiji | 33.7 /100 | #192 | Fair 65.0% |
| Immigrants | Europe | 33.6 /100 | #193 | Fair 65.0% |
| Immigrants | Southern Europe | 31.3 /100 | #194 | Fair 65.0% |
| Romanians | 31.1 /100 | #195 | Fair 65.0% |
| Haitians | 30.6 /100 | #196 | Fair 65.0% |
| Immigrants | Italy | 28.7 /100 | #197 | Fair 65.0% |
| Greeks | 26.1 /100 | #198 | Fair 64.9% |
| Mexican American Indians | 23.1 /100 | #199 | Fair 64.9% |
| Armenians | 20.2 /100 | #200 | Fair 64.9% |
| Ukrainians | 19.6 /100 | #201 | Poor 64.9% |
| Immigrants | Belgium | 19.4 /100 | #202 | Poor 64.9% |
| Russians | 18.8 /100 | #203 | Poor 64.9% |
| Slovenes | 18.7 /100 | #204 | Poor 64.9% |