Austrian vs Turkish In Labor Force | Age > 16
COMPARE
Austrian
Turkish
In Labor Force | Age > 16
In Labor Force | Age > 16 Comparison
Austrians
Turks
64.6%
IN LABOR FORCE | AGE > 16
4.6/ 100
METRIC RATING
235th/ 347
METRIC RANK
66.1%
IN LABOR FORCE | AGE > 16
99.6/ 100
METRIC RATING
79th/ 347
METRIC RANK
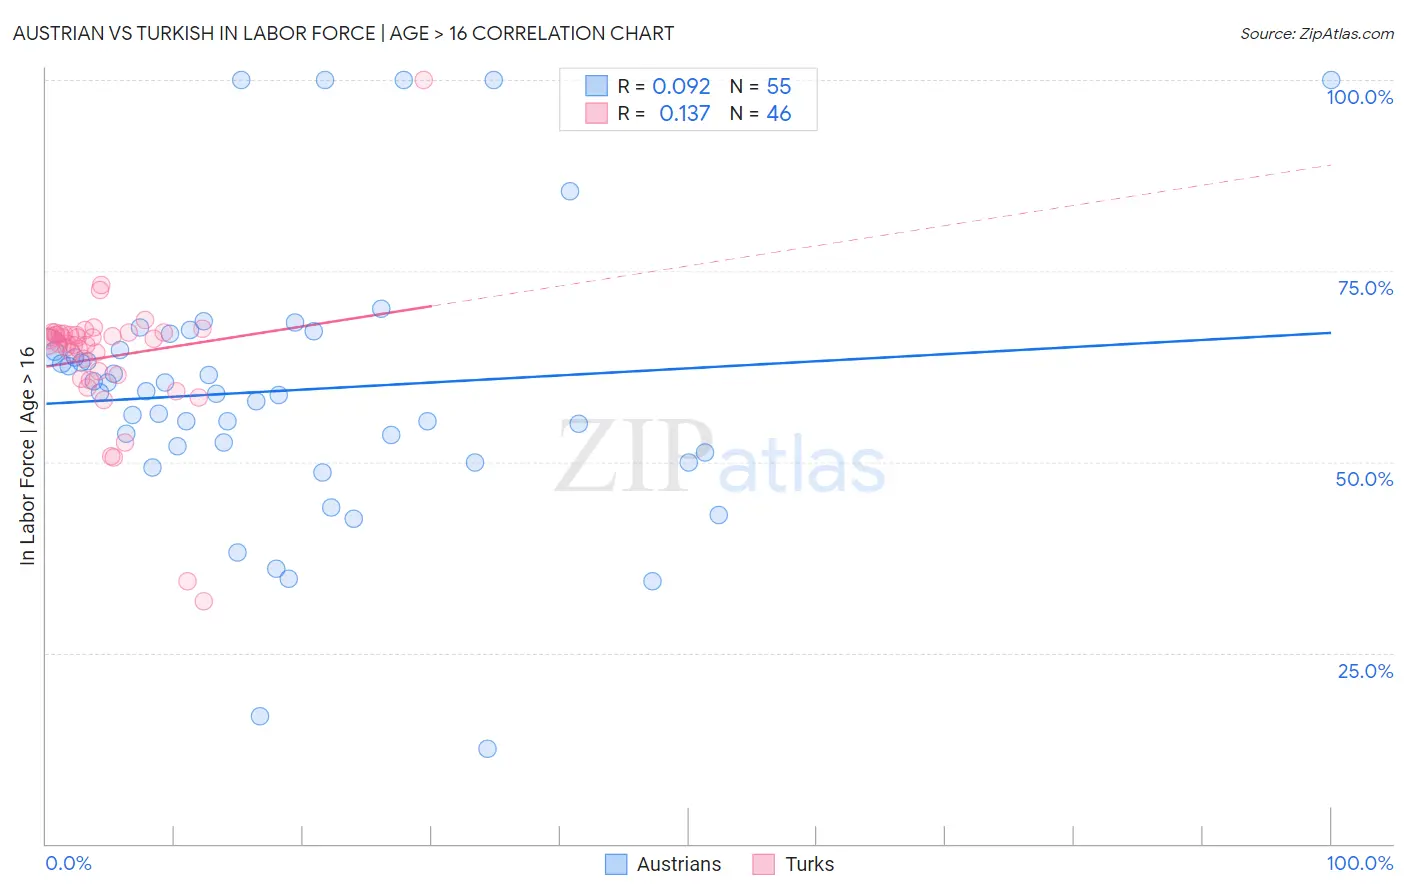
Austrian vs Turkish In Labor Force | Age > 16 Correlation Chart
The statistical analysis conducted on geographies consisting of 452,087,528 people shows a slight positive correlation between the proportion of Austrians and labor force participation rate among population ages 16 and over in the United States with a correlation coefficient (R) of 0.092 and weighted average of 64.6%. Similarly, the statistical analysis conducted on geographies consisting of 271,859,072 people shows a poor positive correlation between the proportion of Turks and labor force participation rate among population ages 16 and over in the United States with a correlation coefficient (R) of 0.137 and weighted average of 66.1%, a difference of 2.4%.
In Labor Force | Age > 16 Correlation Summary
| Measurement | Austrian | Turkish |
| Minimum | 12.5% | 31.7% |
| Maximum | 100.0% | 100.0% |
| Range | 87.5% | 68.3% |
| Mean | 59.4% | 63.7% |
| Median | 59.1% | 65.9% |
| Interquartile 25% (IQ1) | 51.2% | 61.4% |
| Interquartile 75% (IQ3) | 65.0% | 66.8% |
| Interquartile Range (IQR) | 13.8% | 5.4% |
| Standard Deviation (Sample) | 17.9% | 9.6% |
| Standard Deviation (Population) | 17.8% | 9.5% |
Similar Demographics by In Labor Force | Age > 16
Demographics Similar to Austrians by In Labor Force | Age > 16
In terms of in labor force | age > 16, the demographic groups most similar to Austrians are Vietnamese (64.6%, a difference of 0.0%), Immigrants from Norway (64.6%, a difference of 0.0%), Italian (64.6%, a difference of 0.0%), Slavic (64.6%, a difference of 0.020%), and Lebanese (64.5%, a difference of 0.050%).
| Demographics | Rating | Rank | In Labor Force | Age > 16 |
| Northern Europeans | 8.2 /100 | #228 | Tragic 64.7% |
| British | 7.3 /100 | #229 | Tragic 64.7% |
| Chinese | 7.3 /100 | #230 | Tragic 64.7% |
| Immigrants | Northern Europe | 7.2 /100 | #231 | Tragic 64.7% |
| Africans | 5.8 /100 | #232 | Tragic 64.6% |
| Slavs | 4.9 /100 | #233 | Tragic 64.6% |
| Vietnamese | 4.7 /100 | #234 | Tragic 64.6% |
| Austrians | 4.6 /100 | #235 | Tragic 64.6% |
| Immigrants | Norway | 4.6 /100 | #236 | Tragic 64.6% |
| Italians | 4.6 /100 | #237 | Tragic 64.6% |
| Lebanese | 3.9 /100 | #238 | Tragic 64.5% |
| Immigrants | Hungary | 3.8 /100 | #239 | Tragic 64.5% |
| Immigrants | Bangladesh | 3.6 /100 | #240 | Tragic 64.5% |
| Immigrants | Dominica | 3.5 /100 | #241 | Tragic 64.5% |
| Immigrants | Netherlands | 3.4 /100 | #242 | Tragic 64.5% |
Demographics Similar to Turks by In Labor Force | Age > 16
In terms of in labor force | age > 16, the demographic groups most similar to Turks are Malaysian (66.1%, a difference of 0.010%), Immigrants from Moldova (66.1%, a difference of 0.030%), Immigrants from Asia (66.1%, a difference of 0.030%), Immigrants from Malaysia (66.1%, a difference of 0.040%), and Moroccan (66.1%, a difference of 0.060%).
| Demographics | Rating | Rank | In Labor Force | Age > 16 |
| Taiwanese | 99.7 /100 | #72 | Exceptional 66.2% |
| Immigrants | Vietnam | 99.7 /100 | #73 | Exceptional 66.2% |
| Immigrants | Korea | 99.7 /100 | #74 | Exceptional 66.2% |
| Immigrants | Singapore | 99.7 /100 | #75 | Exceptional 66.2% |
| Immigrants | Malaysia | 99.6 /100 | #76 | Exceptional 66.1% |
| Immigrants | Moldova | 99.6 /100 | #77 | Exceptional 66.1% |
| Immigrants | Asia | 99.6 /100 | #78 | Exceptional 66.1% |
| Turks | 99.6 /100 | #79 | Exceptional 66.1% |
| Malaysians | 99.6 /100 | #80 | Exceptional 66.1% |
| Moroccans | 99.5 /100 | #81 | Exceptional 66.1% |
| German Russians | 99.4 /100 | #82 | Exceptional 66.1% |
| Immigrants | Jordan | 99.4 /100 | #83 | Exceptional 66.1% |
| Central Americans | 99.4 /100 | #84 | Exceptional 66.1% |
| Mongolians | 99.4 /100 | #85 | Exceptional 66.1% |
| South Americans | 99.4 /100 | #86 | Exceptional 66.0% |