Australian vs Immigrants from Belarus In Labor Force | Age 20-64
COMPARE
Australian
Immigrants from Belarus
In Labor Force | Age 20-64
In Labor Force | Age 20-64 Comparison
Australians
Immigrants from Belarus
79.5%
IN LABOR FORCE | AGE 20-64
46.0/ 100
METRIC RATING
176th/ 347
METRIC RANK
80.1%
IN LABOR FORCE | AGE 20-64
96.4/ 100
METRIC RATING
93rd/ 347
METRIC RANK
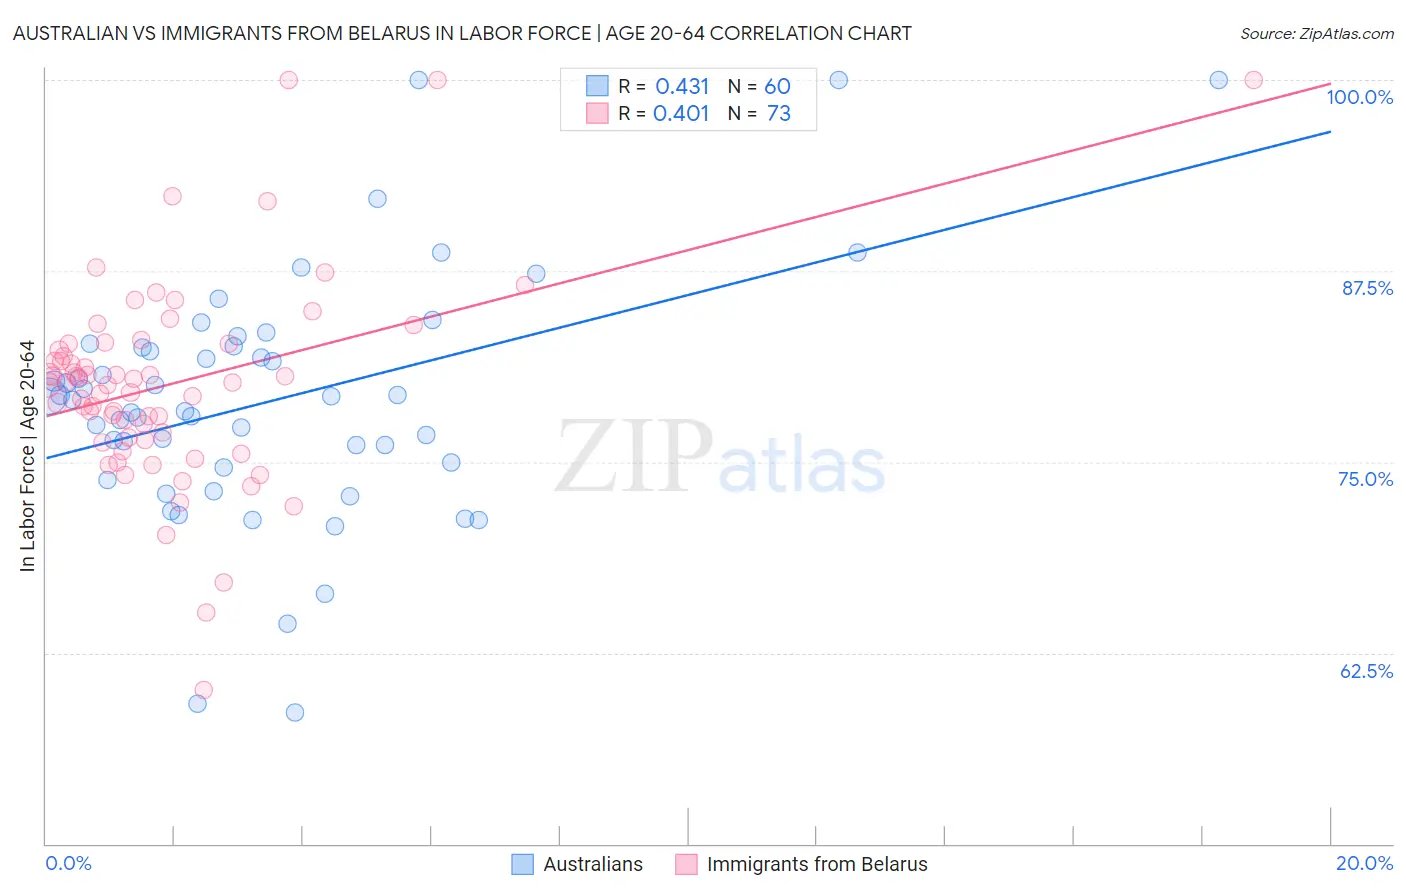
Australian vs Immigrants from Belarus In Labor Force | Age 20-64 Correlation Chart
The statistical analysis conducted on geographies consisting of 224,163,078 people shows a moderate positive correlation between the proportion of Australians and labor force participation rate among population between the ages 20 and 64 in the United States with a correlation coefficient (R) of 0.431 and weighted average of 79.5%. Similarly, the statistical analysis conducted on geographies consisting of 150,198,984 people shows a moderate positive correlation between the proportion of Immigrants from Belarus and labor force participation rate among population between the ages 20 and 64 in the United States with a correlation coefficient (R) of 0.401 and weighted average of 80.1%, a difference of 0.69%.
In Labor Force | Age 20-64 Correlation Summary
| Measurement | Australian | Immigrants from Belarus |
| Minimum | 58.6% | 60.1% |
| Maximum | 100.0% | 100.0% |
| Range | 41.4% | 39.9% |
| Mean | 79.0% | 80.1% |
| Median | 79.2% | 80.2% |
| Interquartile 25% (IQ1) | 74.8% | 76.5% |
| Interquartile 75% (IQ3) | 82.6% | 82.7% |
| Interquartile Range (IQR) | 7.8% | 6.2% |
| Standard Deviation (Sample) | 8.0% | 6.7% |
| Standard Deviation (Population) | 8.0% | 6.7% |
Similar Demographics by In Labor Force | Age 20-64
Demographics Similar to Australians by In Labor Force | Age 20-64
In terms of in labor force | age 20-64, the demographic groups most similar to Australians are Cuban (79.5%, a difference of 0.0%), Immigrants from Netherlands (79.5%, a difference of 0.010%), Czechoslovakian (79.5%, a difference of 0.010%), Syrian (79.6%, a difference of 0.030%), and Armenian (79.5%, a difference of 0.040%).
| Demographics | Rating | Rank | In Labor Force | Age 20-64 |
| Laotians | 58.4 /100 | #169 | Average 79.6% |
| Slavs | 54.0 /100 | #170 | Average 79.6% |
| Immigrants | Switzerland | 53.3 /100 | #171 | Average 79.6% |
| Immigrants | Belgium | 53.1 /100 | #172 | Average 79.6% |
| Immigrants | Scotland | 52.4 /100 | #173 | Average 79.6% |
| Syrians | 50.0 /100 | #174 | Average 79.6% |
| Cubans | 46.1 /100 | #175 | Average 79.5% |
| Australians | 46.0 /100 | #176 | Average 79.5% |
| Immigrants | Netherlands | 45.2 /100 | #177 | Average 79.5% |
| Czechoslovakians | 44.3 /100 | #178 | Average 79.5% |
| Armenians | 41.4 /100 | #179 | Average 79.5% |
| Salvadorans | 41.0 /100 | #180 | Average 79.5% |
| Immigrants | Saudi Arabia | 37.7 /100 | #181 | Fair 79.5% |
| Malaysians | 37.1 /100 | #182 | Fair 79.5% |
| Immigrants | Hungary | 36.8 /100 | #183 | Fair 79.5% |
Demographics Similar to Immigrants from Belarus by In Labor Force | Age 20-64
In terms of in labor force | age 20-64, the demographic groups most similar to Immigrants from Belarus are Polish (80.1%, a difference of 0.020%), Uruguayan (80.1%, a difference of 0.020%), Ghanaian (80.1%, a difference of 0.020%), Immigrants from Asia (80.1%, a difference of 0.020%), and Yugoslavian (80.1%, a difference of 0.020%).
| Demographics | Rating | Rank | In Labor Force | Age 20-64 |
| Immigrants | Egypt | 97.1 /100 | #86 | Exceptional 80.1% |
| Croatians | 97.1 /100 | #87 | Exceptional 80.1% |
| Chileans | 97.0 /100 | #88 | Exceptional 80.1% |
| Immigrants | Venezuela | 96.8 /100 | #89 | Exceptional 80.1% |
| Poles | 96.8 /100 | #90 | Exceptional 80.1% |
| Uruguayans | 96.7 /100 | #91 | Exceptional 80.1% |
| Ghanaians | 96.7 /100 | #92 | Exceptional 80.1% |
| Immigrants | Belarus | 96.4 /100 | #93 | Exceptional 80.1% |
| Immigrants | Asia | 96.0 /100 | #94 | Exceptional 80.1% |
| Yugoslavians | 95.9 /100 | #95 | Exceptional 80.1% |
| Immigrants | Malaysia | 95.9 /100 | #96 | Exceptional 80.1% |
| South Americans | 95.9 /100 | #97 | Exceptional 80.1% |
| Immigrants | Uruguay | 95.8 /100 | #98 | Exceptional 80.1% |
| Immigrants | Chile | 95.7 /100 | #99 | Exceptional 80.1% |
| Filipinos | 95.6 /100 | #100 | Exceptional 80.1% |