Puerto Rican vs Immigrants from Belarus In Labor Force | Age 20-64
COMPARE
Puerto Rican
Immigrants from Belarus
In Labor Force | Age 20-64
In Labor Force | Age 20-64 Comparison
Puerto Ricans
Immigrants from Belarus
73.1%
IN LABOR FORCE | AGE 20-64
0.0/ 100
METRIC RATING
338th/ 347
METRIC RANK
80.1%
IN LABOR FORCE | AGE 20-64
96.4/ 100
METRIC RATING
93rd/ 347
METRIC RANK
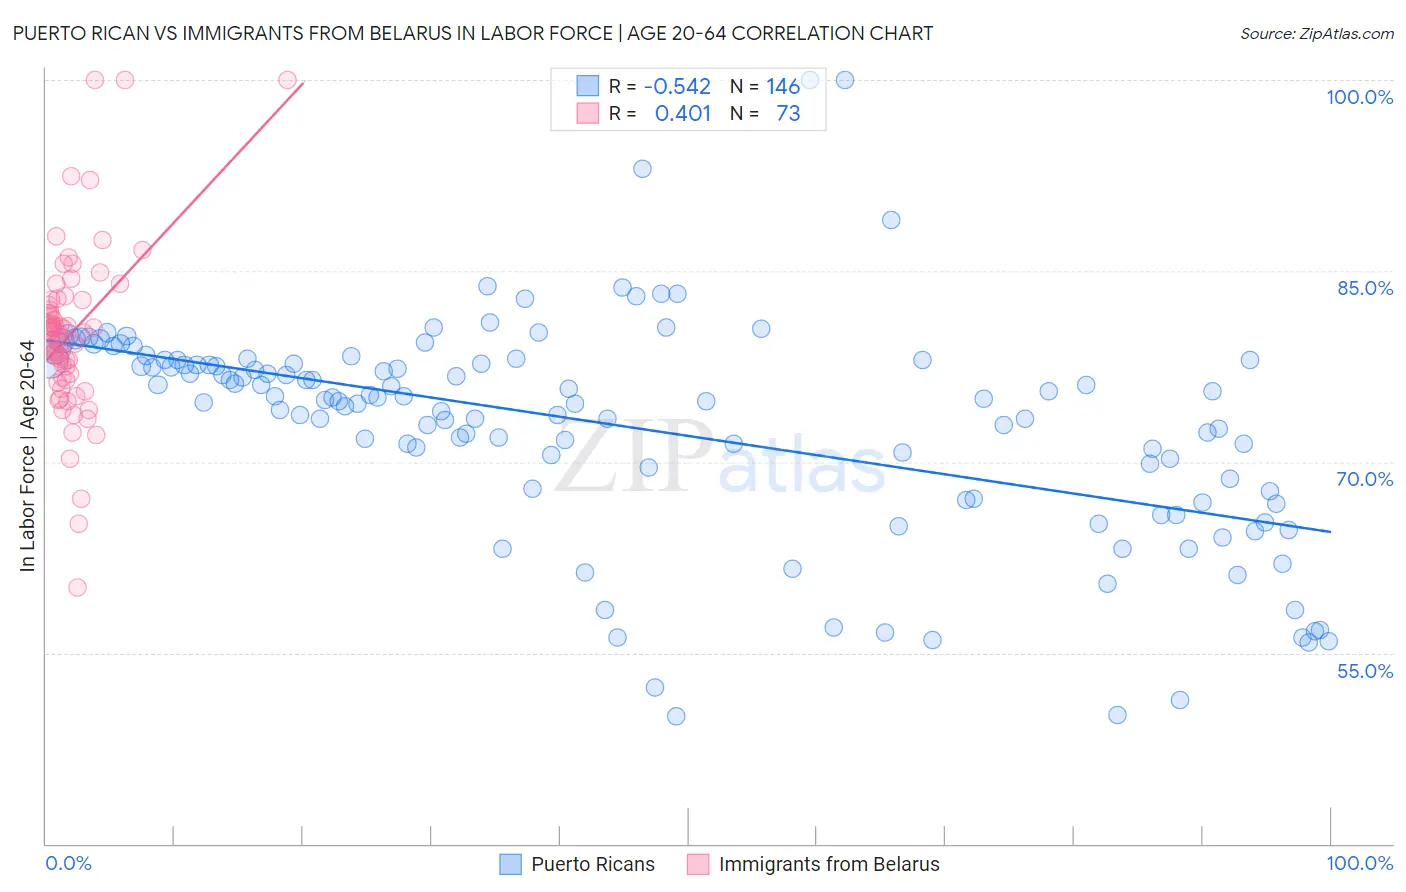
Puerto Rican vs Immigrants from Belarus In Labor Force | Age 20-64 Correlation Chart
The statistical analysis conducted on geographies consisting of 528,297,294 people shows a substantial negative correlation between the proportion of Puerto Ricans and labor force participation rate among population between the ages 20 and 64 in the United States with a correlation coefficient (R) of -0.542 and weighted average of 73.1%. Similarly, the statistical analysis conducted on geographies consisting of 150,198,984 people shows a moderate positive correlation between the proportion of Immigrants from Belarus and labor force participation rate among population between the ages 20 and 64 in the United States with a correlation coefficient (R) of 0.401 and weighted average of 80.1%, a difference of 9.6%.
In Labor Force | Age 20-64 Correlation Summary
| Measurement | Puerto Rican | Immigrants from Belarus |
| Minimum | 50.0% | 60.1% |
| Maximum | 100.0% | 100.0% |
| Range | 50.0% | 39.9% |
| Mean | 72.9% | 80.1% |
| Median | 74.9% | 80.2% |
| Interquartile 25% (IQ1) | 67.9% | 76.5% |
| Interquartile 75% (IQ3) | 78.0% | 82.7% |
| Interquartile Range (IQR) | 10.1% | 6.2% |
| Standard Deviation (Sample) | 8.7% | 6.7% |
| Standard Deviation (Population) | 8.7% | 6.7% |
Similar Demographics by In Labor Force | Age 20-64
Demographics Similar to Puerto Ricans by In Labor Force | Age 20-64
In terms of in labor force | age 20-64, the demographic groups most similar to Puerto Ricans are Yup'ik (73.2%, a difference of 0.21%), Crow (73.3%, a difference of 0.32%), Houma (72.7%, a difference of 0.43%), Pueblo (72.6%, a difference of 0.59%), and Ute (73.7%, a difference of 0.83%).
| Demographics | Rating | Rank | In Labor Force | Age 20-64 |
| Paiute | 0.0 /100 | #331 | Tragic 74.7% |
| Arapaho | 0.0 /100 | #332 | Tragic 74.4% |
| Natives/Alaskans | 0.0 /100 | #333 | Tragic 73.9% |
| Apache | 0.0 /100 | #334 | Tragic 73.7% |
| Ute | 0.0 /100 | #335 | Tragic 73.7% |
| Crow | 0.0 /100 | #336 | Tragic 73.3% |
| Yup'ik | 0.0 /100 | #337 | Tragic 73.2% |
| Puerto Ricans | 0.0 /100 | #338 | Tragic 73.1% |
| Houma | 0.0 /100 | #339 | Tragic 72.7% |
| Pueblo | 0.0 /100 | #340 | Tragic 72.6% |
| Immigrants | Yemen | 0.0 /100 | #341 | Tragic 72.3% |
| Yuman | 0.0 /100 | #342 | Tragic 71.7% |
| Hopi | 0.0 /100 | #343 | Tragic 71.7% |
| Lumbee | 0.0 /100 | #344 | Tragic 70.6% |
| Tohono O'odham | 0.0 /100 | #345 | Tragic 70.4% |
Demographics Similar to Immigrants from Belarus by In Labor Force | Age 20-64
In terms of in labor force | age 20-64, the demographic groups most similar to Immigrants from Belarus are Polish (80.1%, a difference of 0.020%), Uruguayan (80.1%, a difference of 0.020%), Ghanaian (80.1%, a difference of 0.020%), Immigrants from Asia (80.1%, a difference of 0.020%), and Yugoslavian (80.1%, a difference of 0.020%).
| Demographics | Rating | Rank | In Labor Force | Age 20-64 |
| Immigrants | Egypt | 97.1 /100 | #86 | Exceptional 80.1% |
| Croatians | 97.1 /100 | #87 | Exceptional 80.1% |
| Chileans | 97.0 /100 | #88 | Exceptional 80.1% |
| Immigrants | Venezuela | 96.8 /100 | #89 | Exceptional 80.1% |
| Poles | 96.8 /100 | #90 | Exceptional 80.1% |
| Uruguayans | 96.7 /100 | #91 | Exceptional 80.1% |
| Ghanaians | 96.7 /100 | #92 | Exceptional 80.1% |
| Immigrants | Belarus | 96.4 /100 | #93 | Exceptional 80.1% |
| Immigrants | Asia | 96.0 /100 | #94 | Exceptional 80.1% |
| Yugoslavians | 95.9 /100 | #95 | Exceptional 80.1% |
| Immigrants | Malaysia | 95.9 /100 | #96 | Exceptional 80.1% |
| South Americans | 95.9 /100 | #97 | Exceptional 80.1% |
| Immigrants | Uruguay | 95.8 /100 | #98 | Exceptional 80.1% |
| Immigrants | Chile | 95.7 /100 | #99 | Exceptional 80.1% |
| Filipinos | 95.6 /100 | #100 | Exceptional 80.1% |