Australian vs Guyanese In Labor Force | Age 20-64
COMPARE
Australian
Guyanese
In Labor Force | Age 20-64
In Labor Force | Age 20-64 Comparison
Australians
Guyanese
79.5%
IN LABOR FORCE | AGE 20-64
46.0/ 100
METRIC RATING
176th/ 347
METRIC RANK
78.1%
IN LABOR FORCE | AGE 20-64
0.0/ 100
METRIC RATING
281st/ 347
METRIC RANK
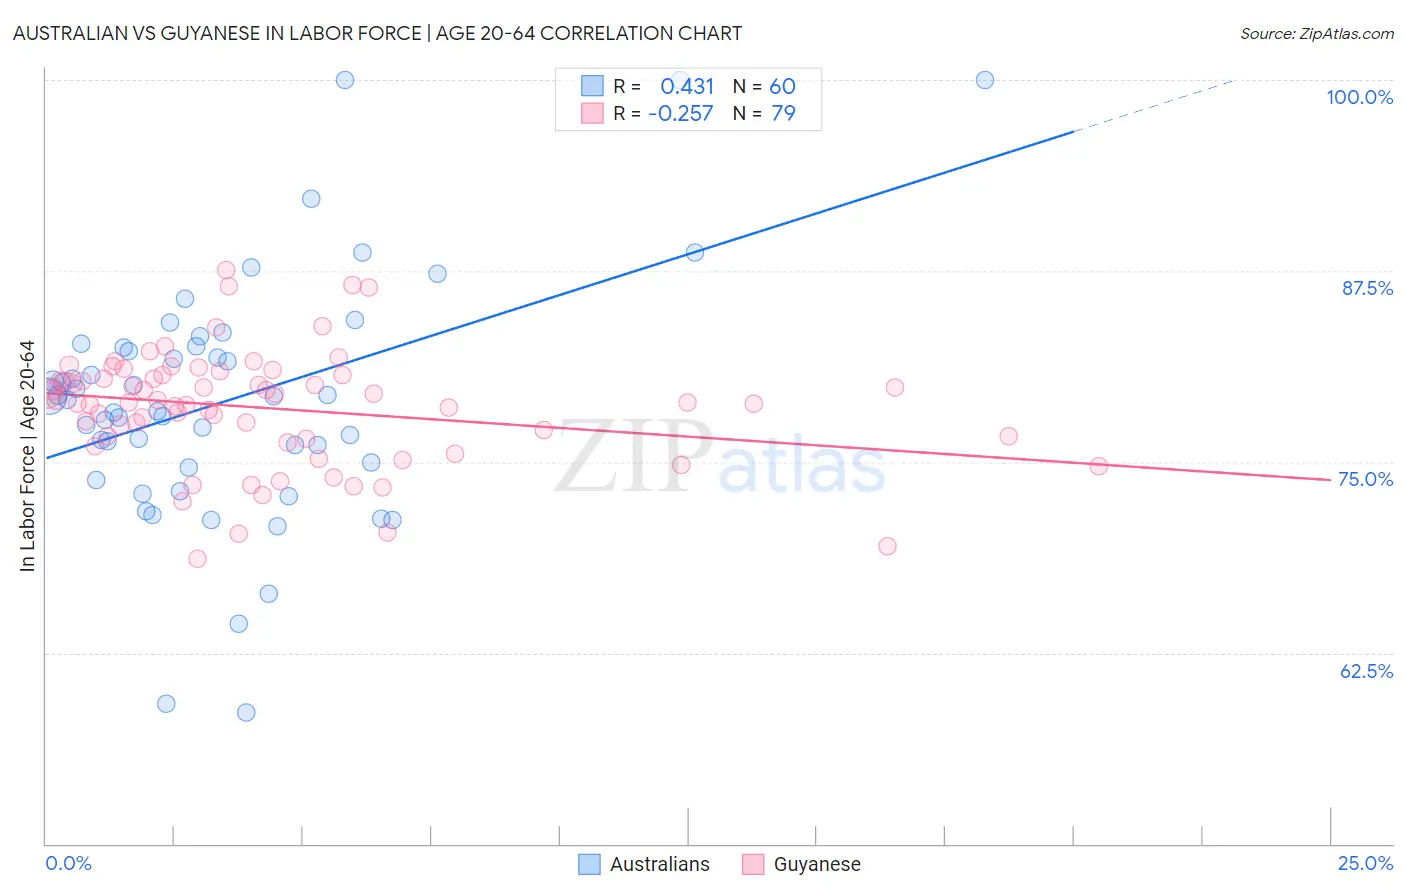
Australian vs Guyanese In Labor Force | Age 20-64 Correlation Chart
The statistical analysis conducted on geographies consisting of 224,163,078 people shows a moderate positive correlation between the proportion of Australians and labor force participation rate among population between the ages 20 and 64 in the United States with a correlation coefficient (R) of 0.431 and weighted average of 79.5%. Similarly, the statistical analysis conducted on geographies consisting of 176,938,027 people shows a weak negative correlation between the proportion of Guyanese and labor force participation rate among population between the ages 20 and 64 in the United States with a correlation coefficient (R) of -0.257 and weighted average of 78.1%, a difference of 1.8%.
In Labor Force | Age 20-64 Correlation Summary
| Measurement | Australian | Guyanese |
| Minimum | 58.6% | 68.6% |
| Maximum | 100.0% | 87.6% |
| Range | 41.4% | 19.0% |
| Mean | 79.0% | 78.5% |
| Median | 79.2% | 78.9% |
| Interquartile 25% (IQ1) | 74.8% | 76.5% |
| Interquartile 75% (IQ3) | 82.6% | 80.7% |
| Interquartile Range (IQR) | 7.8% | 4.1% |
| Standard Deviation (Sample) | 8.0% | 3.8% |
| Standard Deviation (Population) | 8.0% | 3.7% |
Similar Demographics by In Labor Force | Age 20-64
Demographics Similar to Australians by In Labor Force | Age 20-64
In terms of in labor force | age 20-64, the demographic groups most similar to Australians are Cuban (79.5%, a difference of 0.0%), Immigrants from Netherlands (79.5%, a difference of 0.010%), Czechoslovakian (79.5%, a difference of 0.010%), Syrian (79.6%, a difference of 0.030%), and Armenian (79.5%, a difference of 0.040%).
| Demographics | Rating | Rank | In Labor Force | Age 20-64 |
| Laotians | 58.4 /100 | #169 | Average 79.6% |
| Slavs | 54.0 /100 | #170 | Average 79.6% |
| Immigrants | Switzerland | 53.3 /100 | #171 | Average 79.6% |
| Immigrants | Belgium | 53.1 /100 | #172 | Average 79.6% |
| Immigrants | Scotland | 52.4 /100 | #173 | Average 79.6% |
| Syrians | 50.0 /100 | #174 | Average 79.6% |
| Cubans | 46.1 /100 | #175 | Average 79.5% |
| Australians | 46.0 /100 | #176 | Average 79.5% |
| Immigrants | Netherlands | 45.2 /100 | #177 | Average 79.5% |
| Czechoslovakians | 44.3 /100 | #178 | Average 79.5% |
| Armenians | 41.4 /100 | #179 | Average 79.5% |
| Salvadorans | 41.0 /100 | #180 | Average 79.5% |
| Immigrants | Saudi Arabia | 37.7 /100 | #181 | Fair 79.5% |
| Malaysians | 37.1 /100 | #182 | Fair 79.5% |
| Immigrants | Hungary | 36.8 /100 | #183 | Fair 79.5% |
Demographics Similar to Guyanese by In Labor Force | Age 20-64
In terms of in labor force | age 20-64, the demographic groups most similar to Guyanese are Immigrants from St. Vincent and the Grenadines (78.1%, a difference of 0.020%), Immigrants from Dominica (78.1%, a difference of 0.030%), Nonimmigrants (78.1%, a difference of 0.030%), Immigrants from Guyana (78.1%, a difference of 0.050%), and Belizean (78.2%, a difference of 0.070%).
| Demographics | Rating | Rank | In Labor Force | Age 20-64 |
| Aleuts | 0.0 /100 | #274 | Tragic 78.2% |
| Spanish | 0.0 /100 | #275 | Tragic 78.2% |
| Puget Sound Salish | 0.0 /100 | #276 | Tragic 78.2% |
| Immigrants | Bahamas | 0.0 /100 | #277 | Tragic 78.2% |
| Mexican American Indians | 0.0 /100 | #278 | Tragic 78.2% |
| Belizeans | 0.0 /100 | #279 | Tragic 78.2% |
| Immigrants | Dominica | 0.0 /100 | #280 | Tragic 78.1% |
| Guyanese | 0.0 /100 | #281 | Tragic 78.1% |
| Immigrants | St. Vincent and the Grenadines | 0.0 /100 | #282 | Tragic 78.1% |
| Immigrants | Nonimmigrants | 0.0 /100 | #283 | Tragic 78.1% |
| Immigrants | Guyana | 0.0 /100 | #284 | Tragic 78.1% |
| Osage | 0.0 /100 | #285 | Tragic 78.0% |
| Immigrants | Belize | 0.0 /100 | #286 | Tragic 78.0% |
| Vietnamese | 0.0 /100 | #287 | Tragic 78.0% |
| Hmong | 0.0 /100 | #288 | Tragic 77.9% |