Australian vs Immigrants from Poland In Labor Force | Age 20-64
COMPARE
Australian
Immigrants from Poland
In Labor Force | Age 20-64
In Labor Force | Age 20-64 Comparison
Australians
Immigrants from Poland
79.5%
IN LABOR FORCE | AGE 20-64
46.0/ 100
METRIC RATING
176th/ 347
METRIC RANK
80.6%
IN LABOR FORCE | AGE 20-64
99.9/ 100
METRIC RATING
35th/ 347
METRIC RANK
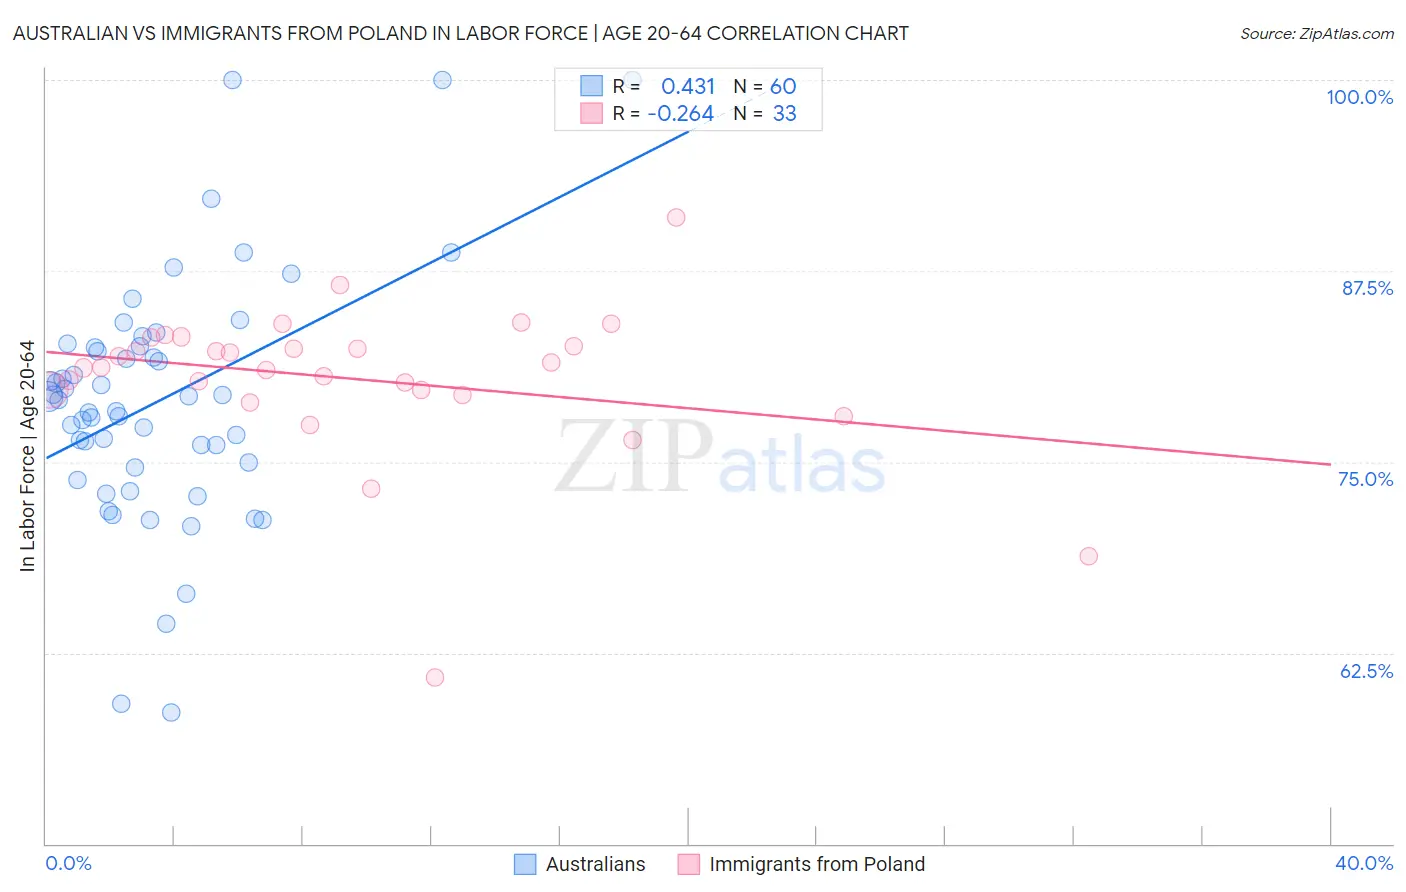
Australian vs Immigrants from Poland In Labor Force | Age 20-64 Correlation Chart
The statistical analysis conducted on geographies consisting of 224,163,078 people shows a moderate positive correlation between the proportion of Australians and labor force participation rate among population between the ages 20 and 64 in the United States with a correlation coefficient (R) of 0.431 and weighted average of 79.5%. Similarly, the statistical analysis conducted on geographies consisting of 304,860,886 people shows a weak negative correlation between the proportion of Immigrants from Poland and labor force participation rate among population between the ages 20 and 64 in the United States with a correlation coefficient (R) of -0.264 and weighted average of 80.6%, a difference of 1.4%.
In Labor Force | Age 20-64 Correlation Summary
| Measurement | Australian | Immigrants from Poland |
| Minimum | 58.6% | 60.9% |
| Maximum | 100.0% | 91.0% |
| Range | 41.4% | 30.1% |
| Mean | 79.0% | 80.4% |
| Median | 79.2% | 81.2% |
| Interquartile 25% (IQ1) | 74.8% | 79.5% |
| Interquartile 75% (IQ3) | 82.6% | 82.9% |
| Interquartile Range (IQR) | 7.8% | 3.3% |
| Standard Deviation (Sample) | 8.0% | 5.1% |
| Standard Deviation (Population) | 8.0% | 5.1% |
Similar Demographics by In Labor Force | Age 20-64
Demographics Similar to Australians by In Labor Force | Age 20-64
In terms of in labor force | age 20-64, the demographic groups most similar to Australians are Cuban (79.5%, a difference of 0.0%), Immigrants from Netherlands (79.5%, a difference of 0.010%), Czechoslovakian (79.5%, a difference of 0.010%), Syrian (79.6%, a difference of 0.030%), and Armenian (79.5%, a difference of 0.040%).
| Demographics | Rating | Rank | In Labor Force | Age 20-64 |
| Laotians | 58.4 /100 | #169 | Average 79.6% |
| Slavs | 54.0 /100 | #170 | Average 79.6% |
| Immigrants | Switzerland | 53.3 /100 | #171 | Average 79.6% |
| Immigrants | Belgium | 53.1 /100 | #172 | Average 79.6% |
| Immigrants | Scotland | 52.4 /100 | #173 | Average 79.6% |
| Syrians | 50.0 /100 | #174 | Average 79.6% |
| Cubans | 46.1 /100 | #175 | Average 79.5% |
| Australians | 46.0 /100 | #176 | Average 79.5% |
| Immigrants | Netherlands | 45.2 /100 | #177 | Average 79.5% |
| Czechoslovakians | 44.3 /100 | #178 | Average 79.5% |
| Armenians | 41.4 /100 | #179 | Average 79.5% |
| Salvadorans | 41.0 /100 | #180 | Average 79.5% |
| Immigrants | Saudi Arabia | 37.7 /100 | #181 | Fair 79.5% |
| Malaysians | 37.1 /100 | #182 | Fair 79.5% |
| Immigrants | Hungary | 36.8 /100 | #183 | Fair 79.5% |
Demographics Similar to Immigrants from Poland by In Labor Force | Age 20-64
In terms of in labor force | age 20-64, the demographic groups most similar to Immigrants from Poland are Immigrants from Brazil (80.7%, a difference of 0.030%), Chinese (80.7%, a difference of 0.050%), Paraguayan (80.6%, a difference of 0.070%), Immigrants from Moldova (80.6%, a difference of 0.070%), and Immigrants from Ireland (80.7%, a difference of 0.090%).
| Demographics | Rating | Rank | In Labor Force | Age 20-64 |
| Immigrants | Uganda | 99.9 /100 | #28 | Exceptional 80.7% |
| Immigrants | South Central Asia | 99.9 /100 | #29 | Exceptional 80.7% |
| Immigrants | North Macedonia | 99.9 /100 | #30 | Exceptional 80.7% |
| Immigrants | Lithuania | 99.9 /100 | #31 | Exceptional 80.7% |
| Immigrants | Ireland | 99.9 /100 | #32 | Exceptional 80.7% |
| Chinese | 99.9 /100 | #33 | Exceptional 80.7% |
| Immigrants | Brazil | 99.9 /100 | #34 | Exceptional 80.7% |
| Immigrants | Poland | 99.9 /100 | #35 | Exceptional 80.6% |
| Paraguayans | 99.8 /100 | #36 | Exceptional 80.6% |
| Immigrants | Moldova | 99.8 /100 | #37 | Exceptional 80.6% |
| Ugandans | 99.8 /100 | #38 | Exceptional 80.6% |
| Brazilians | 99.8 /100 | #39 | Exceptional 80.5% |
| Immigrants | Zimbabwe | 99.8 /100 | #40 | Exceptional 80.5% |
| Immigrants | Liberia | 99.8 /100 | #41 | Exceptional 80.5% |
| Latvians | 99.8 /100 | #42 | Exceptional 80.5% |